
|
There are several ways chartists can use the StockCharts Technical Rank (SCTR) to find winning stocks and ETFs. First, note that we have SCTRs for US large-caps, US mid-caps, US small-caps, Toronto stocks and ETFs. Leveraged and inverse ETFs are excluded from the ETF group. The securities in each group are ranked against each other. The rankings, therefore, do not overlap and are not comparable outside the group.
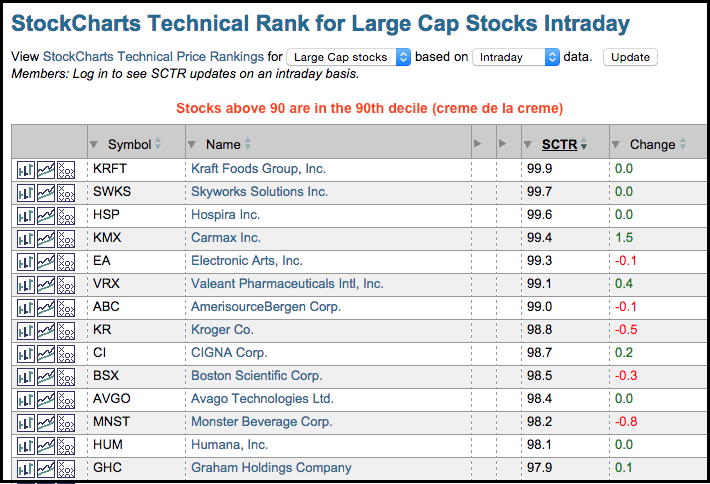
The SCTRs in each group range from zero to one hundred. Using large-caps as an example, stocks scoring between zero and ten would be in the bottom decile (10th percentile). Stocks scoring between ninety and one hundred would be in the top decile (90th percentile). Chartists looking for the strongest stocks or ETFs should focus on the scores between 80 and 100.
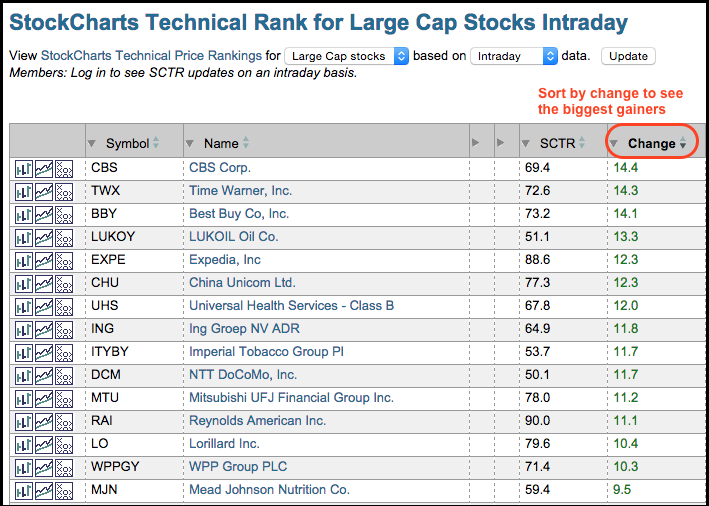
Chartists can also sort the SCTR tables by clicking each column heading. Sorting by "change" will reveal the biggest movers, which is a great way to find stocks making big relative gains. Chartists can click the icons on the left of each symbol to see different charts. The icon with the bars is for your default chart style, the icon with lines shows a gallery chart and the XO icon shows a Point & Figure chart. You can read more about the StockCharts Technical Rank (SCTR) in our ChartSchool article.
