
|
Most SharpCharts include a histogram at the bottom of the chart that represent the trading volume for each bar. Sometimes it is useful to add a moving average to those bars to see when unusual volume days occurs. Here are the steps to do that...
Start with a "Standard" SharpChart with overlaid volume
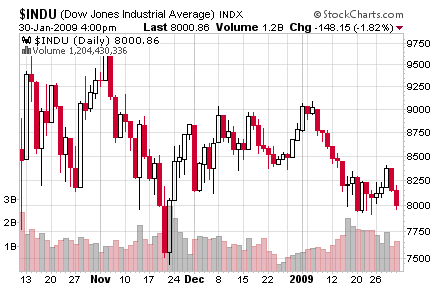
To create this example, chart $INDU, then apply the "SCC Default" ChartStyle, then use both "Clear All" buttons to remove the overlays and indicators. (Or just click here)
Turn off Volume in the "Chart Attributes" area

The "Volume" setting in the "Chart Attributes" area is really a "shortcut" way to add volume to a chart. If you want to adjust the Volume display (which we need to do in this case), you can use the "Volume" indicator instead. But before adding the indicator, we need to remove the "shortcut" by changing the "Volume" setting to "Off" (#1) and clicking "Update" (#2).
Now add Volume to the chart as a "Behind Price" Indicator

Select "Volume" from the Indicators dropdown. Next select "Behind Price" from the "Position" dropdown, then click the "Update" button.
Checking our progress

At this point, our chart looks the same as before - which is what we wanted. Now however we can add the Moving Average to the Volume Indicator...
Add the Moving Average to the Volume indicator (Easy)

If you are a Free user (or you just need a quick EMA) you can enter the number of periods for your Moving Average in the "Parameters" box, then click the "Update" button. You should see a red EMA line appear on your volume bars. Note that you can only add an Exponential Moving Average using this method.
Add the Moving Average to the Volume Indicator (Advanced)

If you are a member of our charting service, you can use the "Advanced Options" area to the right of the Indicators to choose what kind of Moving Average you wish to add. (If the "Advanced Options" area isn't visible, click the green triangle icon to make it appear.) Use the "Overlay" dropdown (red box) to select the moving average overlay that you are interested in then enter the period for the average in the "Parameters" box. Finally, click the "Update" button. Here's what the finished chart should look like:

