
|
In this tutorial, we'll go over the basics of creating high-quality financial charts using SharpCharts, the main charting tool at StockCharts.com
In this example, let's assume that we've just read a nice article about a company called "Hudson Technologies" and we'd like to examine their stock chart closely.
Our first problem is that we need to find out what the ticker symbol for Hudson Technologies is, then we need to create a simple chart for it, then we need to start customizing the chart. Let's get started...
Bring up StockCharts.com
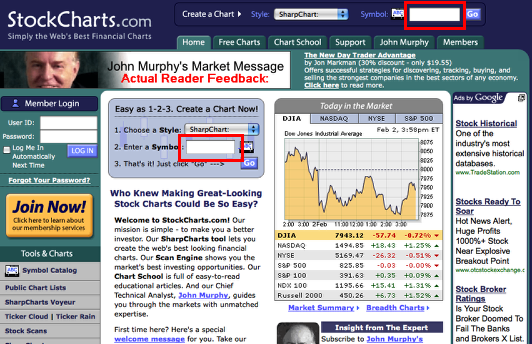
Using almost any web browser you want, enter http://stockcharts.com in the address bar and press Enter to pull up our homepage. You should see something similar to the picture above.
To create a SharpChart, simply enter the ticker symbol of the stock you are interested in into either of the boxes I've outllined in red and then press the "Go" button. That will take you directly to the SharpCharts workbench.
In this case however, we have a problem - we don't know what ticker symbol for Hudson Technologies is. How do we find it?
Since this is a common problem, we've made it easy to search for companies even if you don't know their ticker symbol - just enter the first part of the company's name in the ticker box and press "Go" and we'll search our database for any matches we can find.
Search for "Hudson"
Enter "Hudson" in the ticker box at the upper right corner of the page (#1) and then click the "Go" button (#2). You should see a search results page similar to the following:
Create a "Default" SharpChart for Hudson Technologies
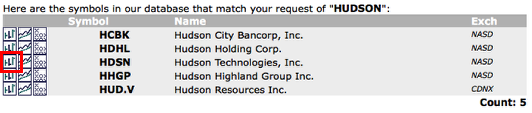
Ah, there we go - "Hudson Technologies, Inc." has the ticker symbol HDSN. To create a chart for HDSN, we could manually type that symbol into the same box we just typed "Hudson" into, we can also just click on the SharpChart icon for HDSN (outlined in red). Either approach will take us to the SharpCharts Workbench page with a Default chart of HDSN on it. (Note: The workbench may appear in a new browser window or tab depending on your browser settings.)
A quick "tour" of the SharpCharts Workbench
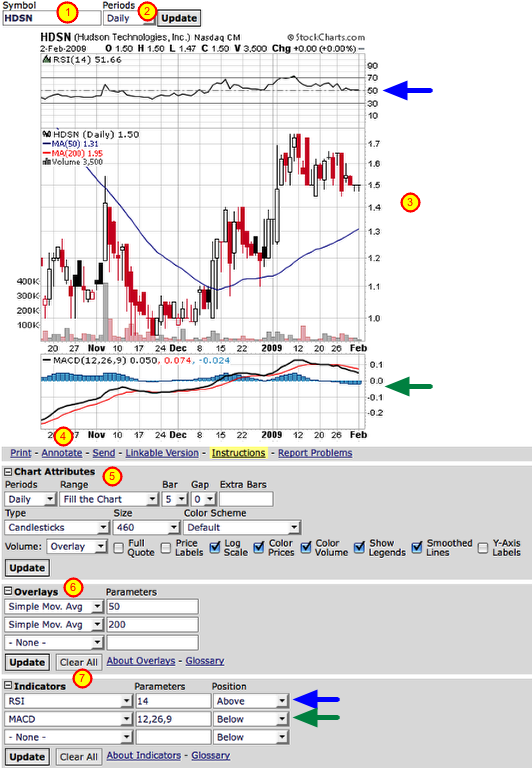
#1.) This is the place where you enter the ticker symbol for the "main" dataset that you want to chart. As we saw earlier, if you don't know the ticker symbol, just enter part of the company name and we'll do a search.
#2.) This dropdown lets you change the time period of the chart. Free users can choose between "Daily" and "Weekly" charts. Subscribers get more choices.
#3.) This is the SharpChart itself. In this case, the "Default Style" is a candlestick chart with 2 overlays and 2 indicators (green and blue arrows).
#4.) The "Annotate" link allows you to draw trendlines, boxes, text and other things on top of the chart.
#5.) The Chart Attributes area lets you change the global characteristics on the chart like its size and colors.
#6.) The Overlays area lets you add technical indicators that appear directly on top of the price bars. - moving averages, Bollinger bands, etc.
#7.) The Indicators area lets you add technical indicators that appear in seperate panels above or below the main price panel.
Important: After changing any of these settings, you have to click any of the Update buttons in order to see those settings appear on the chart.
Start Experimenting and Learning
SharpCharts is a very powerful tool for creating detailed technical financial charts. The best way to learn more about it is to start using it. Try adding new indicators, changing the colors, making the chart bigger, etc. If you need more help, click the yellow "Instructions" link located just below the SharpChart. If you get stuck, use the "Report Problems" link to ask us for help.
Note that subscribers to our service have access to larger charts, more indicators per chart, fewer ads, intraday or real-time information, the ability to store annotated charts, and much more. Click here for more details.
Thanks for taking the time to learn more about SharpCharts and StockCharts.com!
