Step-by-Step January 03, 2013 at 09:00 PM
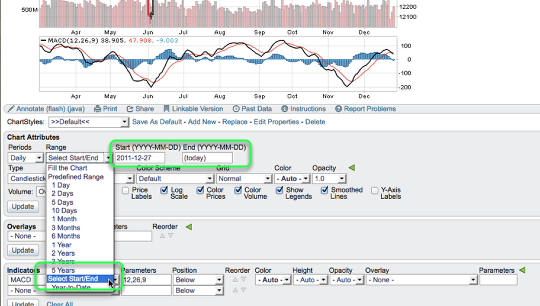
Have you needed to view a past indicator or overlay value but don't know how? Below are the options on how to view a previous day's indicator or overlay value. Change the Date Range One way to view the indicator or overlay value for a date in the past is to use the "select start/end" date range and put the end date for the day you want to view the indicator/overlay value for. To select this option go to the "chart attributes" section, click the "range" drop-down, select the option "select start/end" and enter in your date Read More
Step-by-Step January 02, 2013 at 04:04 PM
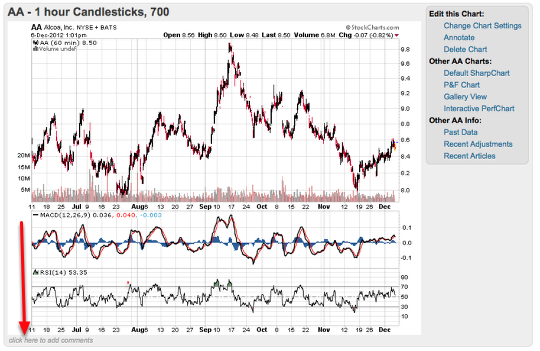
Having the ability to add comments to a chart is a great way for you to point out key items you wish to remember. In this tutorial you will find the steps on how to add comments onto a chart directly using the ChartNotes Annotation tools or how to add comments about a chart using the 10 per page view or edit page. 10 Per Page View One way to add comments about a chart is to use the 10 per page view. When viewing charts using this view you will notice a text box located below the chart that says "click here to add Read More
Step-by-Step January 01, 2013 at 05:06 PM
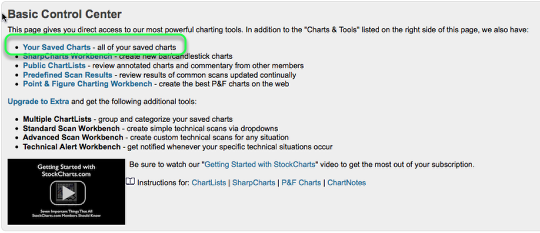
Have you wanted to see what stocks in your ChartList are the best or worst performers? As a subscriber you have this option by viewing your ChartList as a MarketCarpet. Depending on your level of service follow the steps below to create your own MarketCarpet. *Free users can view our predefined MarketCarpets located on our Free Charts page. Basic Members As a Basic member you can view your current ChartList as a Market Carpet. To do this go to the Read More