Top Advisors Corner August 30, 2019 at 01:14 PM
We currently have trade wars, presidential tweets, inversions in the yield curve, slowing earnings growth, decreasing corporate share buybacks and all manner of other problems affecting the stock market... Read More
Top Advisors Corner August 28, 2019 at 01:07 PM
SPX Monitoring purposes; Sold SPX on 8/27/19 at 2869.16= gain .77; long 8/23/19 at 2847.60. Monitor purposes GOLD: Long GDX on 1/29/19 at 21.96. Long Term Trend SPX monitor purposes; Sold SPX 7/5/19 & 2990.41= gain 2.63%... Read More
Top Advisors Corner August 22, 2019 at 01:45 PM
The whole media world is abuzz lately with talk of the inversion in the yield curve and what it means for a potential recession. The track record is mixed there, and there is much debate among academics about whether it is "different this time... Read More
Top Advisors Corner August 21, 2019 at 12:17 PM
SPX Monitoring purposes: Sold long SPX on 8/19/19 at 2923.65 = gain 2.67% : long 2847.60 on 8/15/19. Monitoring purposes GOLD: Long GDX on 1/29/19 at 21.96. Long Term Trend SPX monitor purposes: Sold SPX 7/5/19 & 2990.41= gain 2.63%... Read More
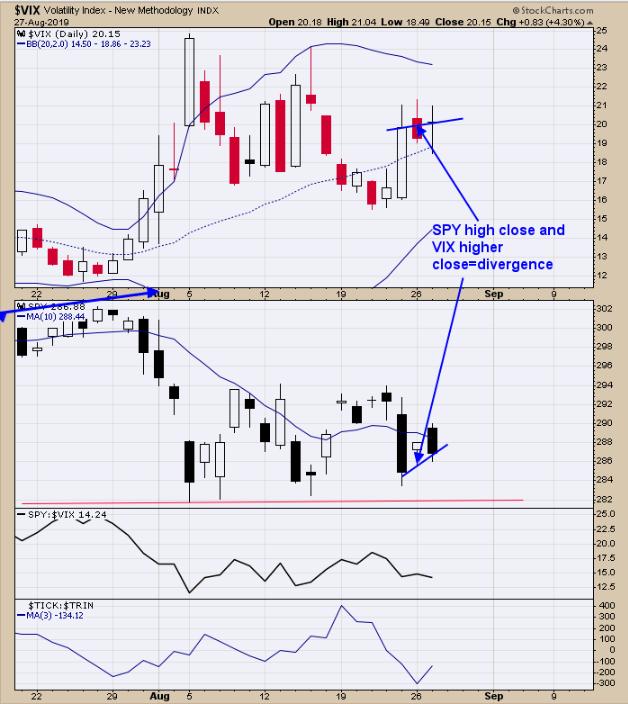
Top Advisors Corner August 19, 2019 at 12:15 PM
This is a line chart which shows the volatility close to close... Read More
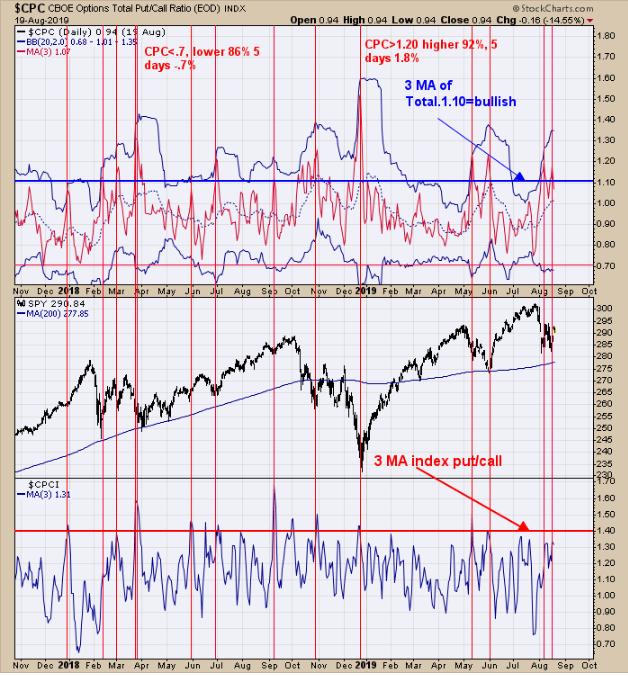
Top Advisors Corner August 15, 2019 at 01:33 PM
The stock market selloff since the last new all-time high on July 26 has brought the bears out, and they have been trading a lot of put options. Some trade those as an outright bearish bet, and some as a hedge on portfolio risk... Read More
Top Advisors Corner August 07, 2019 at 01:19 PM
The stock and T-Bond prices often move in opposite directions, and, as of August 2019, that movement has reached a pretty extreme degree. The basis for that statement is from the indicator in this week's chart, which comes about through some fairly simple math... Read More
Top Advisors Corner August 07, 2019 at 01:09 PM
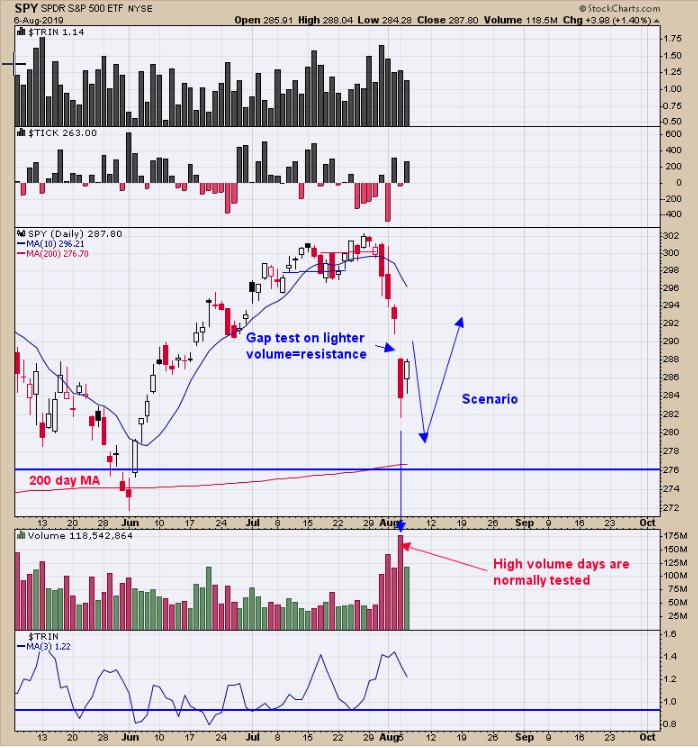
SPX Monitoring purposes: Neutral. Monitoring purposes GOLD: Long GDX on 1/29/19 at 21.96. Long Term Trend SPX monitor purposes: Sold SPX 7/5/19 & 2990.41= gain 2.63%. Today's rally did not touch yesterday's down gap, but came close... Read More
Top Advisors Corner August 02, 2019 at 07:23 PM
A 'transition phase' - from a market rising on the back of a presumption of a series of Fed rate cuts, this would indeed would seem to be what's underway... Read More
Top Advisors Corner August 02, 2019 at 02:29 PM
Quietness is a sign of trader complacency, and thus of a topping condition for prices. Quietness manifests itself in a variety of ways, and can also be measured in a bunch of different ways. Most often, chartists will use Average True Range (ATR) to look at what prices are doing... Read More