This is a series of articles designed to remind each of us the keys to identifying the many potential warning signs that create stock market tops. If you're just tuning in, you can CLICK HERE for Part 1 that begins the series. Enjoy!
Today, I want to delve into the very important relationship between treasury yields and stock prices. Before doing so, let me explain how this relationship SHOULD work. First of all, it's important to understand that treasury PRICES and treasury YIELDS always have an INVERSE relationship. When treasuries are being bought and treasury prices are rising, it sends yields lower. And when treasuries are being sold, treasury prices fall and treasury yields rise.
Next, there's a common sense component. Consider that investors and traders have a decision to make with an investment dollar. They can put that dollar into treasuries for safety or they can put that dollar in equities for potential capital appreciation, but with higher risk. Or they can invest it with some combination, say 20 cents into treasuries and 80 cents in equities, or vice versa. It simply depends on that particular investor's risk tolerance, return requirements or a host of other considerations. But the bottom line is that we all must make that basic decision each and every trading day. If we decide to put all of our capital to work in treasuries, it will obviously aid the treasury market, sending treasury prices higher and yields LOWER. This decision to forego equities will not help the stock market in any way and if everyone decides to take this approach, equity prices will suffer and eventually move lower as well. So the key (short-term) relationship between these two asset classes is that when money rotates towards one group and we see appreciation in prices there, there's an opposite effect on the other. If treasury prices are rising from money rotating there, equity prices (think S&P 500) tend to move lower as money rotates away from that asset class. Going back to my first point, when treasury prices rise, treasury yields fall. That means that treasury yields and the S&P 500 should move in unison since they both move opposite treasury prices.
That is the relationship I'm looking for - treasury yields and the S&P 500 moving together - as I illustrate a few warning signs in years past. Keep in mind this is a VERY simple illustration, not considering other outside influences on both of these asset classes. I'm only considering the very short-term effect of money rotating between these two asset classes. Outside influences can drive treasury prices - things like inflation, dollar strength and weakness, GDP growth, global interest rate environment, etc. So understand that the relationship that I'm discussing is fairly short-term in nature. In fact, if you look back at the long-term (several decades), you'd see that the S&P 500 has moved much higher while treasury yields have remained in a steady decline. They seem to move in opposite directions. Check it out:
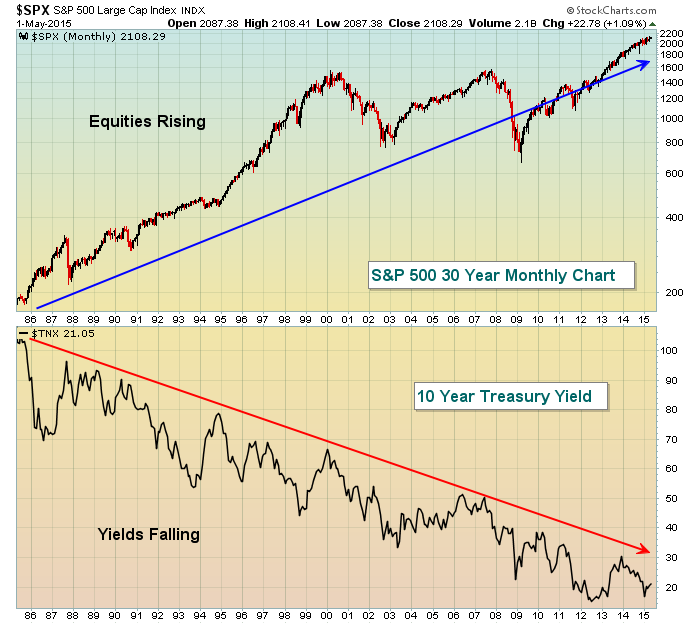
But I want to focus on how these two are tied in the very near-term. If I'm trying to determine if the S&P 500 is topping today, I really don't care what happened to treasury yields over the past 30 years. I simply want to know whether money is flowing into or out of that asset class TODAY. Let's continue to focus on the various bull and bear markets during this century for illustration purposes. In the short-term, if the S&P 500 is rising, I like to see the 10 year treasury yield rising along with it because it tells me that, in the short-term, money is moving out of treasuries and the proceeds from that selling help to fuel the rise in S&P 500 prices. While the above chart appears to show little positive correlation between the S&P 500 and the 10 year treasury yield, I think a shorter-term view may appear quite different. Take a look from 2000 to 2007:
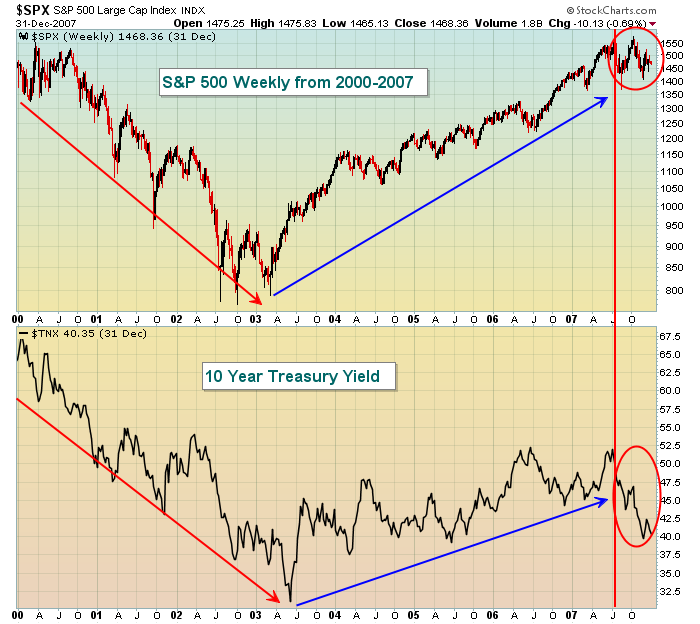
A few things stand out to me when I look at this chart. While the S&P 500 pushes to 8 year highs in 2007, the 10 year yield does not. However, the shorter-term trends certainly appear to move hand in hand - both are trending lower together and both trend higher together. Well, until 2007 that is. The yield began to fall rapidly in 2007, suggesting that investors were growing more cautious and wanted the safety of U.S. treasuries (red circles). As we evaluate the health of a rise in equity prices, the hair on the back of your neck should rise along with the S&P 500 when treasury yields don't support the rise in equities. By itself, we might grow a bit more cautious. But this warning sign piled on top of all the other warning signs I've discussed in this series and they're now beginning to add up. The desire to "convict" that bull market was growing without a doubt.
The treasury-equity relationship really began to turn interesting as the latest bear market engulfed the stock market. So let's take a look at this same chart, but for the period 2008 to 2015:
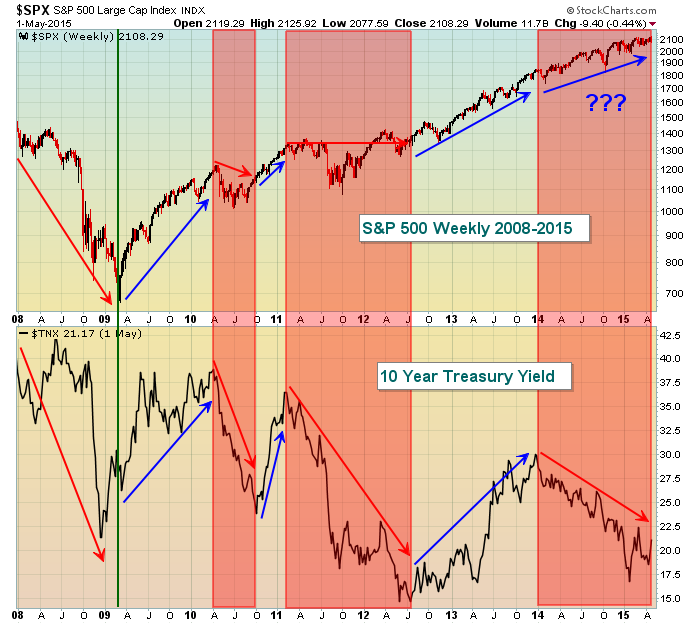
Over the past seven years, the 10 year treasury yield has declined while we've seen a huge push higher in the S&P 500. Despite this appearance of the two moving in opposite directions, I've specifically highlighted in red the periods when treasury yields have fallen precipitously. Remember, the falling yield means treasury prices are rising. And every dollar that moves into treasuries is a dollar that cannot move into equities. Note how weak the performance is in the S&P 500 during these red highlighted periods. The last 15 months is the lone exception and if a ton of other warning signs had emerged, I'd be much more concerned about a market top. That isn't the case, however. Now look at the periods when yields have risen (lower treasury prices), and check out how quickly the S&P 500 rose during those periods. Based on this short-term positive correlation, it's important for us to watch the technical developments on the 10 year treasury yield as short-term breakouts should be viewed quite bullishly for equities. Currently, Fed officials are discussing the possibility of higher interest rates down the road. If that's the case, we'll see more selling in treasuries and the probability of more buying in equities increases.
So why do yields keep falling in the longer-term? There are a number of factors. First and foremost the Federal Reserve undertook its quantitative easing program several years ago to keep interest rates artificially low while at the same time trying to revive our economy, specifically the housing market. This move has been unprecedented and has encouraged investment in both treasuries and equities simultaneously. The U.S. treasury market has attracted BILLIONS of dollars from around the globe as the U.S. has been seen as the "safety net" during the global financial meltdown and its subsequent recovery. This is one of those "outside influences" that I discussed earlier that really has had little bearing on the stock market. If anything, this cheap money has actually aided public companies in the U.S. and that is reflected in all-time highs in the S&P 500.
The lesson here is to watch the short-term direction of U.S. treasury yields and the technical significance of each move. Then tie this signal together with other signals discussed in this series to make an objective call about the likely direction of U.S. equity prices. The downtrending 10 year treasury yield since 2014 certainly poses a risk to the current bull market as money flows into treasuries, but at least for now it appears this downtrend is due to outside influences, and not suggesting a sell off of U.S. equities.
Happy trading!
Tom
