Another insightful issue of the ChartWachers Newsletter has arrived!

Delivering The Web's Best Financial Commentary Straight To Your Inbox

April 1, 2017

Hello Fellow ChartWatchers!

Welcome to the latest edition of the ChartWatchers newsletter. Before we dive into this week's articles, I have a few big announcements to share with you about two new additions to StockCharts.com! So, without further adieu...

Introducing MarketWatchers LIVE!

I'm delighted to officially announce the launch of our new active market web show! Starting this Monday, April 3rd, Tom Bowley and Erin Heim will be co-hosting a new web show together, called MarketWatchers LIVE. Join Tom and Erin online during the trading day as they decipher the current market action in real time! Follow along as they share their expert analysis and reveal the charts that you need to be watching to stay ahead of the curve. For more information, Click Here.

MarketWatchers LIVE will air Mondays, Wednesdays and Fridays from 12:00pm - 1:30pm ET. Plus, as part of this new web show, we've eliminated the need to pre-register days in advance. When Tom and Erin's show is on air, you'll notice a red notification in the top right corner of the SharpCharts Workbench. Hover over that message, then click the green "Watch Now" button to join! You'll also see a message and green "Watch Now" button appear at the top of our blogs page when the show is live.

MarketWatchers LIVE will air in addition to our monthly webinar series, The StockCharts Outlook, which was introduced earlier this year. The StockCharts Outlook is hosted by Greg Schnell and Tom Bowley on the second Saturday of each month. It focuses on investing education and longer-term technical analysis of the markets. Tune in to watch the experts explain what they're seeing on the charts, debate and discuss where the markets are heading, and provide powerful insights into how they use the tools and features on StockCharts.com. For more info about The StockCharts Outlook, Click Here.

(note: MarketWatchers LIVE is a "live market action" web show focused on real-time market activity during the trading day. It will therefore not be recorded. The StockCharts Outlook, however, will be recorded and archived for later viewing.)


New Blog from Tushar Chande!

In addition to our new web show, we have also just added an exciting new blog, Trend Check, written by master technician, Tushar Chande! Tushar is the inventor behind an impressive collection of technical indicators, including the Aroon and Stochastic RSI. He has written several books, holds both a PhD in Engineering and an MBA in Finance, and has over two decades of experience in the financial markets developing and trading systematic strategies. Tushar's latest project, ETFMeter.com, recently caught our attention, and we are thrilled to add his insightful commentary to StockCharts.com.

If you're looking for a clear-cut, easy-to-follow evaluation of the market from a technical perspective, the Trend Check blog is your answer. As Tushar said himself in his first post, "One of the key principles driving this blog will be data compression. All of you are busy, and have many other irons in the fire. My job is to boil things down, to concentrate the information into nuggets of valuable information."

To read Tushar's first post in his new Trend Check blog, Click Here!

Until next time!

- Grayson Roze

Having trouble viewing this email? Click Here to view online

This Week's Articles

The Market Message

Percent of Stocks Over 200-Day Average Turns Back Up

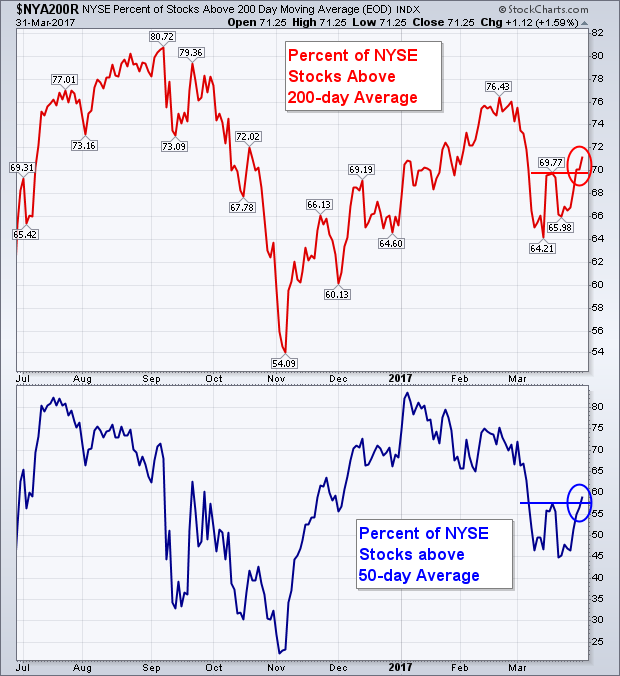
Article Image My last two messages have stressed the importance of the 200-day moving average. It's what separates uptrends from downtrends. In order to sustain a bull market, more stocks have be above their 200-day average than below it. And that is currently the case. The red line in Chart 5 is the percent of NYSE stocks above their 200-moving average (which I also showed on Thursday).
Read Article

Bookstore Special

Art's Charts

Finding New Highs and Measuring Trend Strength with Stochastics

Article Image The Stochastic Oscillator is best known as a momentum indicator, but a careful look at the formula reveals that it can also be used to measure trend strength. As noted in a previous article on MACD, it is imperative that chartists fully understand an indicator to get the most out of it. The Stochastic Oscillator is a simple indicator that is really easy to understand. This article will start
Read Article

The Canadian Technician

A Medical Marijuana ETF (HMMJ) Begins Trading This Week - No April Fools Joke

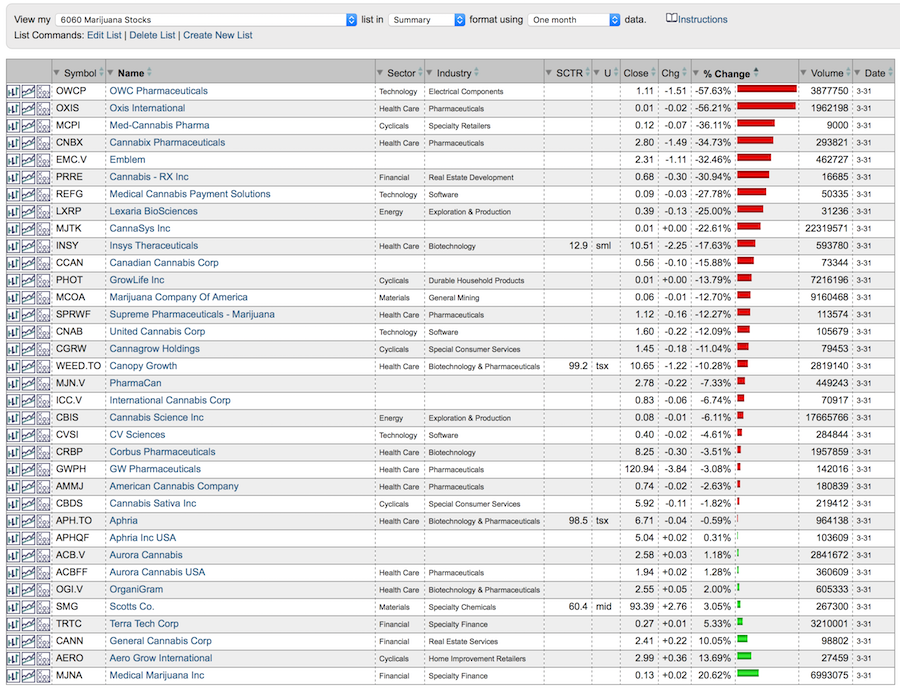
Article Image The Stock Market is a real-time place to see the true spirit of Greed and Fear come to the forefront. Technicians use the words Supply and Demand to study the market characteristics. Over the last few years, one of the most interesting areas of the market is the niche ETF for finding specific areas of investor interest. This week marks the rollout of the 'Horizons Medical Marijuana...
Read Article

Trading Places

5 Reasons Why This Isn't 2007

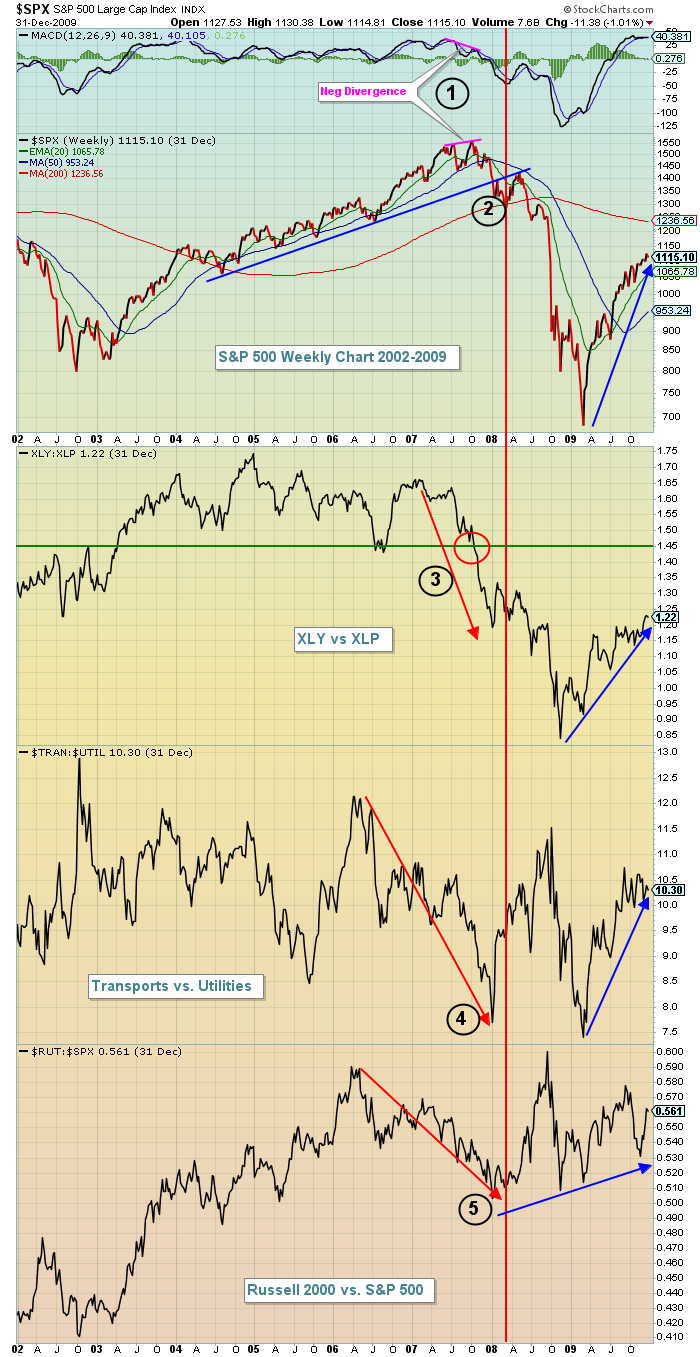
Article Image Many market pundits on CNBC continue to predict a market top, discussing how we've run too far too fast and that valuations are too high and blah, blah, blah. Fear sells and CNBC is all about their ratings and advertisements. There's an occasional nugget of solid information, especially if there's a worthwhile guest on to listen to. But keep in mind what their end goal is
Read Article

InvestEd Central

Trust Your Good Work

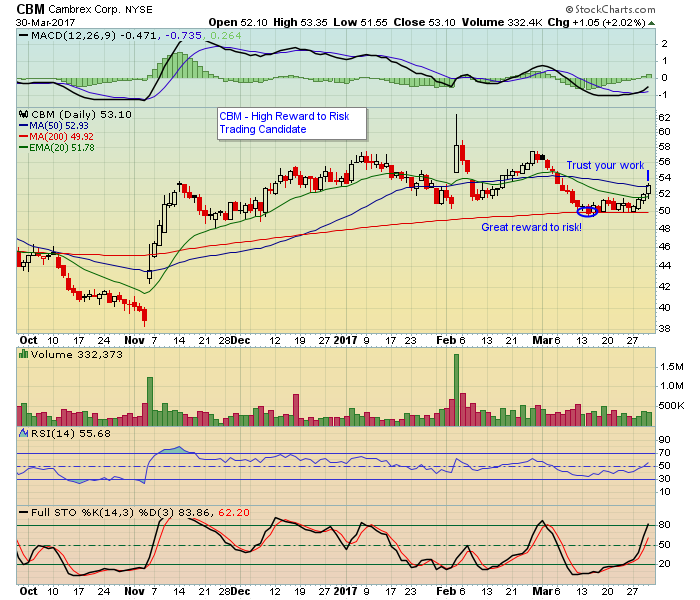
Article Image If you trade stocks you're going to run into situations where you question whether or not you are making good decisions. This could include identifying entry levels and setting price targets and stop losses. It could also include pulling the trigger on a trade, taking a loss or even locking in profits which is sometimes easier said than done. At EarningsBeats we issue trade alerts to our
Read Article

DecisionPoint

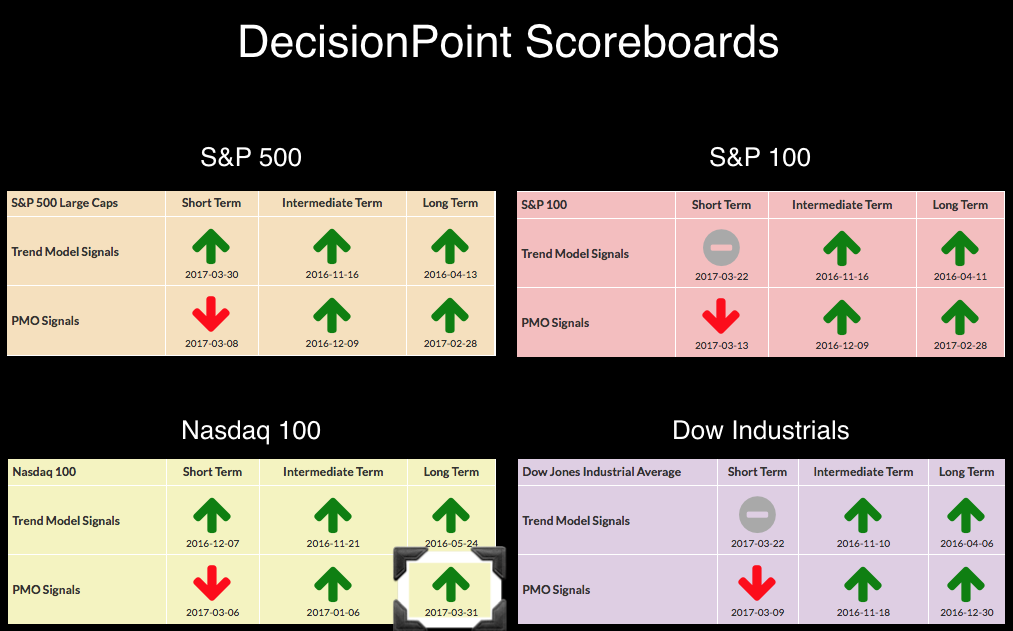
Monthly PMO BUY Signal for Nasdaq 100

Article Image Patience was rewarded today as the Long-Term Price Momentum Oscillator (PMO) confirmed a BUY signal that had been pending most of the month. We don't log new monthly PMO signals until the chart goes "final" on the last trading day of the month. Similarly, we don't log new weekly
Read Article

The Traders Journal

35 Years and 5 Key Personal Investment Passages

Article Image I stumbled into a gift shop full of tchotchkes today. It was one of those retailers with endless trinkets and specialty items that encourage you to revisit your youth and marvel at someone else's creativity. I became fascinated by one of those intricately detailed Russian "Matryoshka" – the wooden nesting dolls of decreasing size placed one inside another. Perhaps because the...
Read Article

See More Articles …

Become a Member

Become a Member

Unlock All of Our
Tools and Features

  • + Larger, Full-Screen Chart Sizes
  • + Intraday Charts with Real-Time Data
  • + Exclusive, Members-Only Commentary
  • + Custom Technical Scans and Alerts
Free 1-Month Trial
Visit ChartSchool

About ChartWatchers

ChartWatchers is our free, twice-monthly newsletter for online investors and StockCharts users. Whether you are brand new to charting or a seasoned analyst, each edition of ChartWatchers brings you insightful, expert commentary from the industry's leading technicians. See what's really happening in the markets through their eyes and gain an edge in your own investing.

f t
For more information about the ChartWatchers Newsletter or to subscribe for free, Click Here
This email was sent to [email]. Need the newsletter sent to a different email address?
Simply unsubscribe your current email, then re-subscribe using the new address.
Click Here to instantly unsubscribe