 |
|
Expert Technical Commentary Delivered Straight To Your Inbox
|
| January 6, 2018 |
|
Hello Fellow ChartWatchers!
First and foremost, I want to wish you all a very happy new year from the team here at StockCharts.com! We have big plans in store for 2018 (including the return of ChartCon this August!) and we simply can't wait to share it with you.
Now, here are a few important announcements:
XABCD Annotation Tool Now In ChartNotes!
Late last month, we introduced a brand new tool to ChartNotes: the XABCD annotation tool! By allowing you to identify and pin a series of significant high and low price points, this unique harmonic pattern tool helps you visualize 5-point chart patterns, both bullish and bearish, as they form. In addition to the XABCD, we're excited to welcome Scott Carney (president and founder of HarmonicTrader.com) to our TAC blog. Scott will be sharing his expertise about harmonic patterns, and will also appear as a guest on our MarketWatchers LIVE web show on January 24th. Be sure to tune in!
To check out the new XABCD tool, pull up a chart of any symbol, then look for the "Annotate" button below. Click that to launch ChartNotes, then click the 5th button down on the sidebar. Under that menu, you'll find the new XABCD tool.
Psst! Don't forget, StockCharts Members can save their annotated charts!
Hey, StockCharts Members, Did You Know...
As a StockCharts Member, you unlock the complete online archives of Technical Analysis of Stocks & Commodities Magazine (also known as TASC). We've partnered with the good folks over at TASC to bring you full access to their digital content online as part of your StockCharts subscription. That even includes the latest edition of the magazine - for free!
In fact, the January edition of Stocks & Commodities Magazine featured an in-depth interview with two of our own: Gatis Roze (author of Tensile Trading and The Traders Journal blog here at StockCharts) and me, Grayson Roze (Business Manager at StockCharts and author of Trading for Dummies). If you're a StockCharts Member, we encourage you to check out the latest edition of Stocks & Commodities Magazine online and browse the TASC archives by clicking here. Not a member yet? Start your FREE 1-month trial!
Until next time,
|
|
|
|
Having trouble seeing this email? Click to view online
|
|
|
|
|
|
|
Global Stocks Start Year With a Bang, S&P 500 is Well Into a Five-Wave Advance
by John Murphy
|
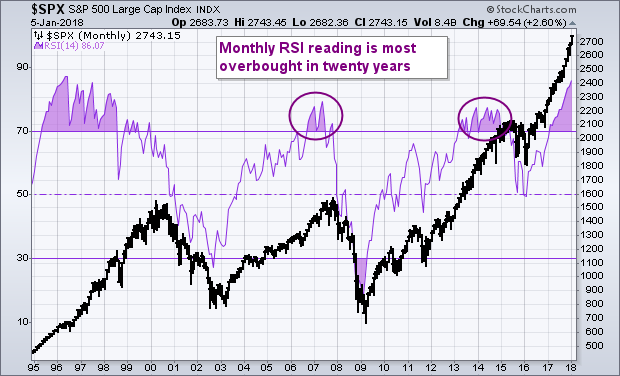 |
Global stock markets started off the new year with a bang. U.S. stock indexes exploded to record highs for the best start in years. Foreign stock benchmarks did the same, including the FTSE All World Stock Index which also hit a new record. New records were set in North America, Europe, and Asia and in both developed and emerging markets. So what's there not to like? Well, there is one thing...
|
|
|
|
|
Bookstore Special
|
|
|
|
Pockets of Strength Outweigh Pockets of Weakness
by Arthur Hill
|
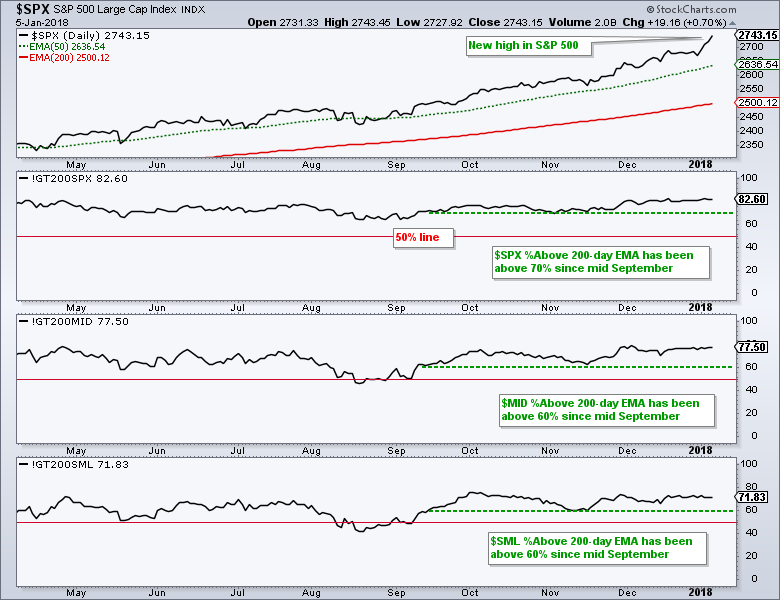 |
The stock market is never 100% bullish with all stocks participating in an uptrend. There are always some holdouts and pockets of weakness, but the broader market can continue higher as long as the pockets of strength are greater than the pockets of weakness. The percentage of stocks above the 200-day EMA is a great way to measure internal strength and this indicator has remained strong...
|
|
|
|
|
|
|
Awaiting Some Relative Strength Clues In Energy Related Stocks
by Greg Schnell
|
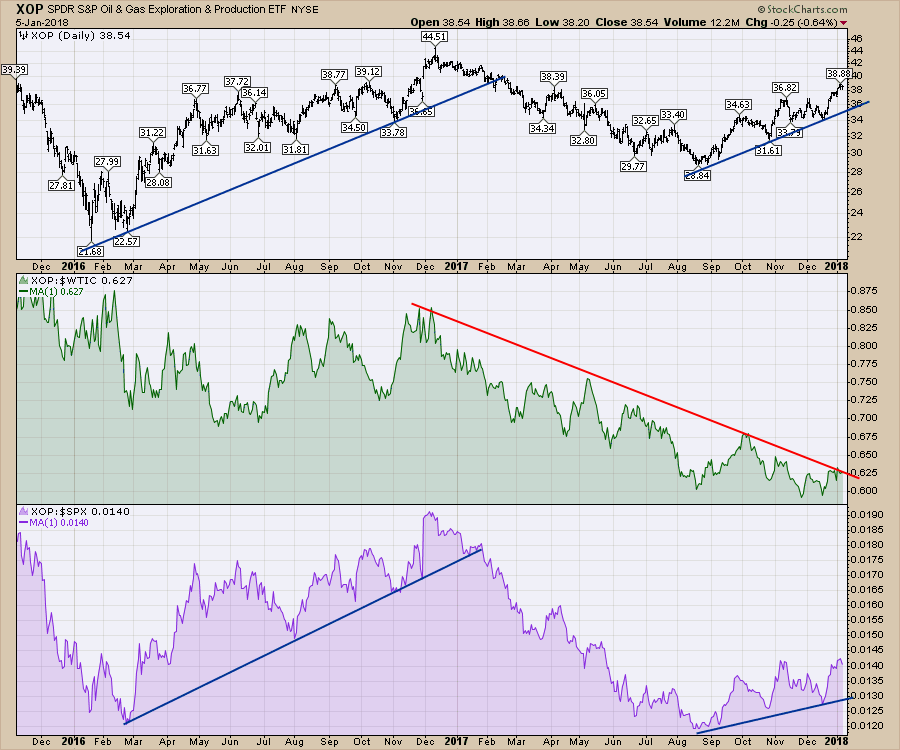 |
Oil trades have had a big beautiful run from June into early January. The commodity related stocks have also run since August. But there are some relative strength relationships we need to see break out to launch the next phase of stock runs. Within the energy space, the recent flare-up in Natural Gas prices appeared as NYMEX traders felt the cold come in. Oil has been a persistent bull
|
|
|
|
 |
|
|
|
2018 Stock Market Forecast
by Tom Bowley
|
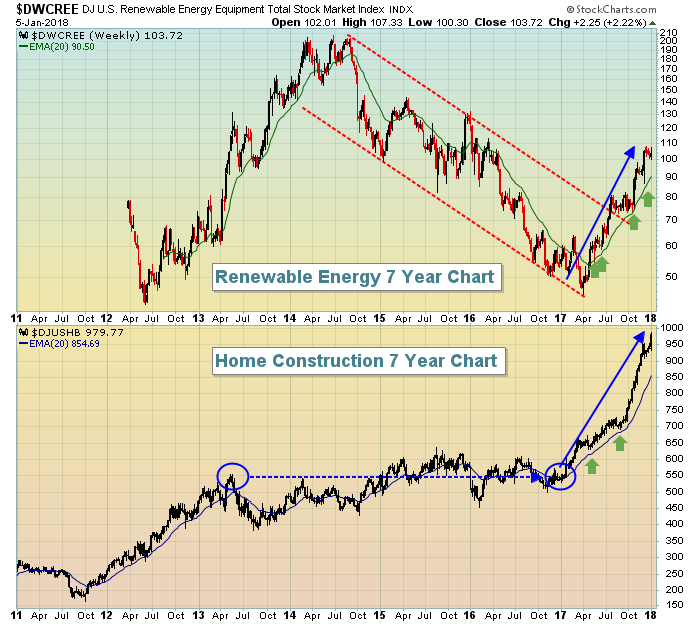 |
HAPPY NEW YEAR! In my first Trading Places blog article of 2018, "Here's One Chart That Screams BUY As We Begin 2018", I highlighted my favorite relative chart in the Current Outlook section. It's one of the biggest reasons why I believe 2018 will simply be an...
|
|
|
|
|
|
|
Market Still Overvalued, or Maybe Not
by Carl Swenlin
|
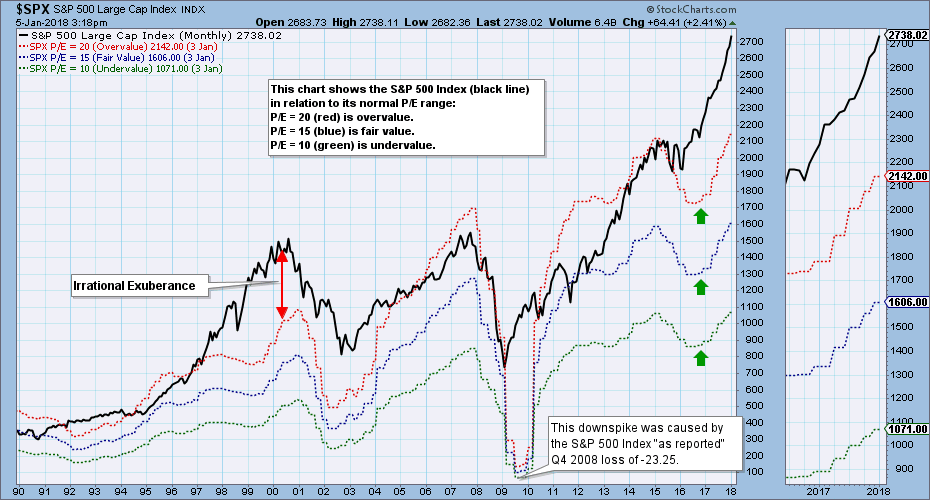 |
Earnings for 2017 Q3 will be finalized soon, but on a preliminary basis the S&P 500 has a P/E of 25, which is extremely overvalued. The chart below shows the S&P 500 Index (black line) in relation to where it would be if it were undervalued (P/E 10 - green line), fair value (P/E 15 - blue line), or overvalued (P/E 20 - red line). Price moved well above that range over two years ago,
|
|
|
|
|
|
|
Here's A Trading Strategy That Works In Any Market
by John Hopkins
|
 |
Ultimately, the U.S. stock market lives and dies by the performance of its economy and how that translates into earnings growth of U.S. companies. Nearly every economic report that we've seen of late has been strong or strengthening. The number of companies that are performing well on their top and bottom lines has been growing. It's evidenced by the number of stocks that we...
|
|
|
|
|
|
|
The #1 Lesson Learned From All My 2017 Trades
by Gatis Roze
|
 |
Over 25 years of full-time trading, it's been my experience that, as an investor, one moves ahead by looking back. In other words, reviewing my 2017 Trading Journal will improve my 2018 results. Indeed, the tenth and final stage of Stock Market Mastery is to Revisit, Retune and Refine. It's a proven discipline that keeps on giving year after year. Having just reviewed my 2017 journal over the...
|
|
|
|
|
|
|
|
|
|
|
Unlock All of Our
Tools and Features
- + Larger, Full-Screen Chart Sizes
- + Intraday Charts with Real-Time Data
- + Exclusive, Members-Only Commentary
- + Custom Technical Scans and Alerts
|
|
|
|
|
 |
|
|
|
ChartWatchers is our free, twice-monthly newsletter for online investors and StockCharts users. Whether you are brand new to charting or a seasoned analyst, each edition of ChartWatchers brings you insightful, expert commentary from the industry's leading technicians. See what's really happening in the markets through their eyes and gain an edge in your own investing.
|
|
|
|
|
|
| For more information about the ChartWatchers Newsletter or to subscribe for free, Click Here |
This email was sent to [email]. Need the newsletter sent to a different email address?
Simply unsubscribe your current email, then re-subscribe using the new address. |
| Click Here to instantly unsubscribe |
|