Art's Charts March 31, 2013 at 03:41 AM
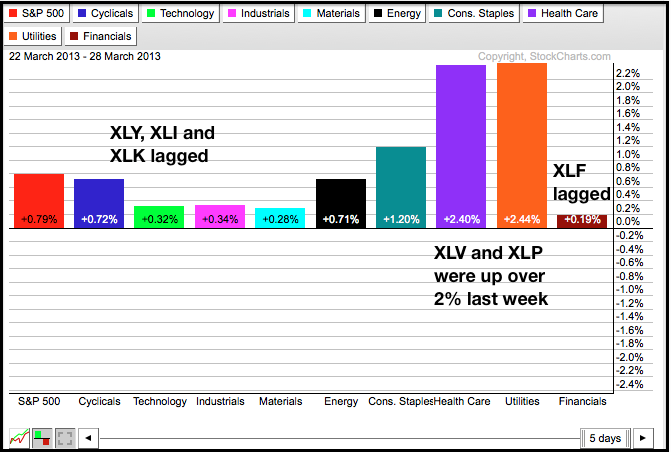
Another week and another new high for the S&P 500. Even though the weekly gain was small, MDY, QQQ and SPY ended the month at their highs for 2013. IWM lagged a little and finished just below its mid March high... Read More
Art's Charts March 28, 2013 at 06:33 AM
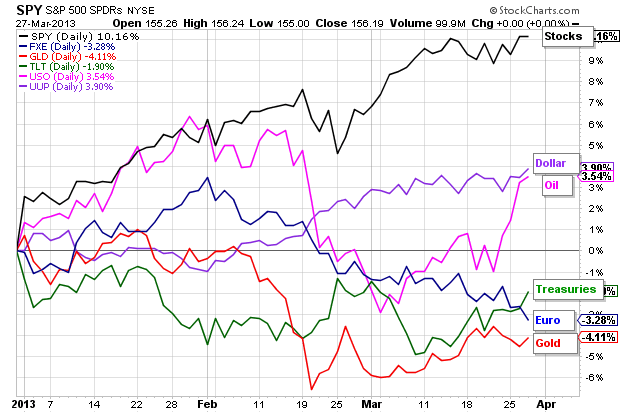
There are plenty of reasons for stocks to move lower – but the stock market is not listening just yet. Stocks are still overbought after a huge rally since mid November and the six month seasonal pattern is set to turn bearish in about a month... Read More
Art's Charts March 28, 2013 at 06:11 AM
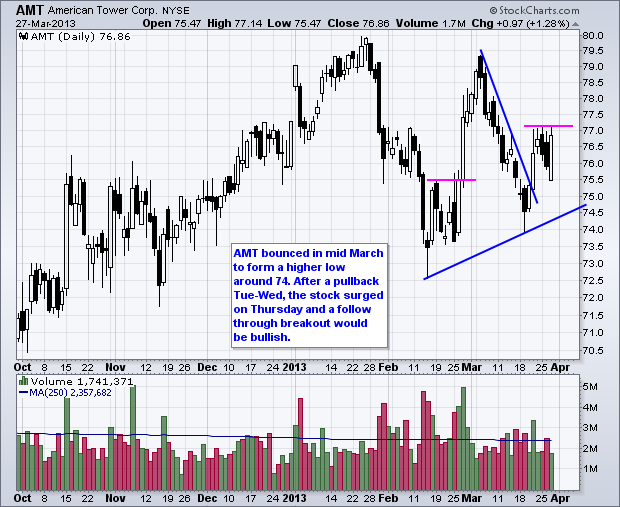
AMT Opens Weak and Closes Strong. ATML Forms a 3-Month Diamond Consolidation. Plus CNX, DVN, FCX, MMM This commentary and charts-of-interest are designed to stimulate thinking... Read More
Art's Charts March 27, 2013 at 06:03 AM
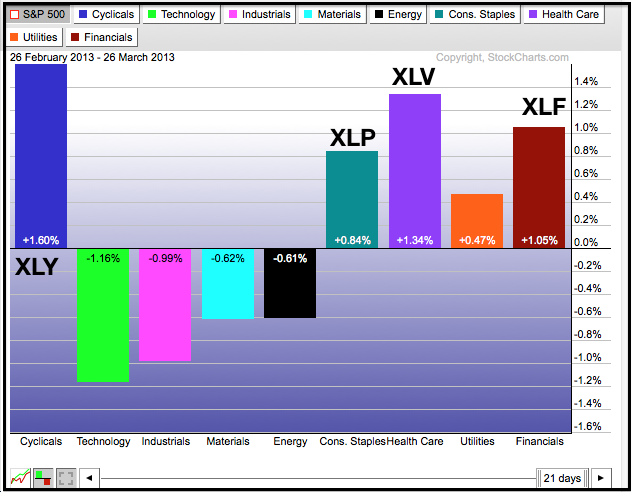
Led by the energy and healthcare sectors, stocks got a bid on Tuesday as the major index ETFs closed modestly higher. Large-caps led the way with the S&P 500 ETF (SPY) advancing .80 percent. All sectors were up, but the four offensive sectors lagged on the day... Read More
Art's Charts March 26, 2013 at 07:13 AM
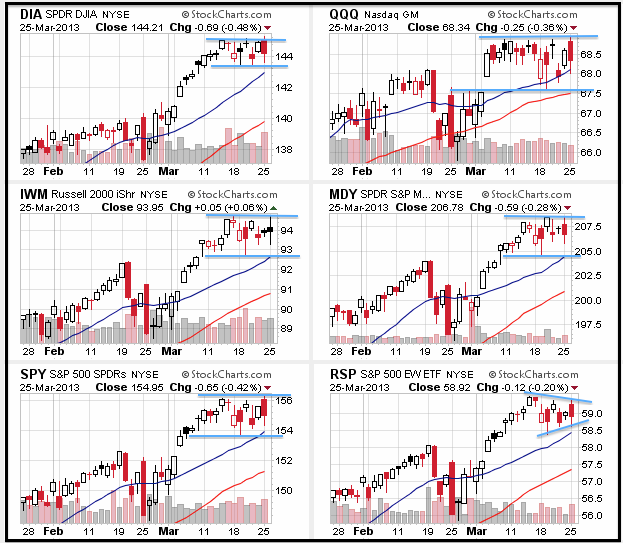
It was a topsy-turvy day for the markets. Stocks opened strong on the heels of a Cyprus deal, but weakened as the details sunk in and EU comments suggested that this "unique" deal could be a template for future bailouts... Read More
Art's Charts March 26, 2013 at 06:48 AM
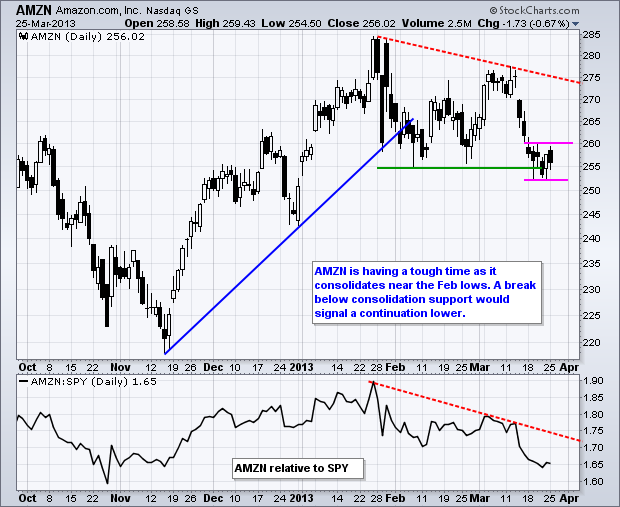
AMZN stalls near support and under performs. COF shows signs of life with volume. Plus DOW, GME, MMM, MS This commentary and charts-of-interest are designed to stimulate thinking... Read More
Art's Charts March 25, 2013 at 06:03 AM
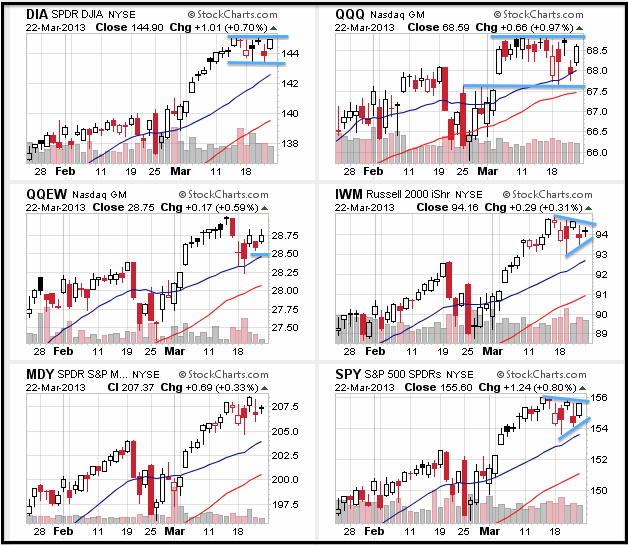
Cyprus has just a few days left – to dominate the news. Yes, once again, last-minute negotiations produced a bailout deal in the 13th hour. What a surprise. Cyprus will officially move to the back burner on Tuesday and we can get back to the real business at hand... Read More
Art's Charts March 22, 2013 at 05:59 AM
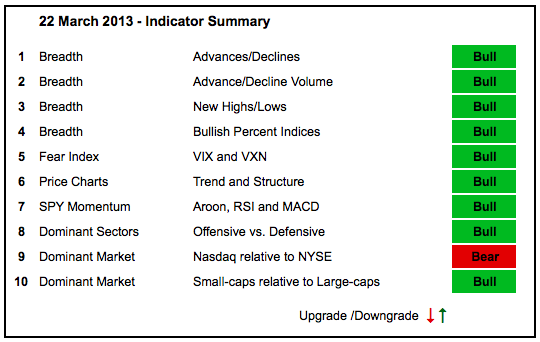
The major index ETFs hit new highs in March, but trading has been relatively flat the last two weeks. Even though the uptrends are firmly in place, flat trading indicates that the market may be moving into corrective mode... Read More
Art's Charts March 22, 2013 at 05:06 AM
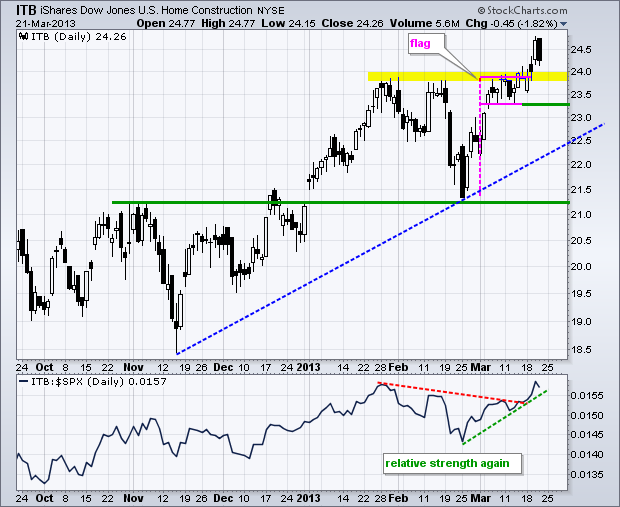
The major index ETFs continue to trade within narrow ranges. SPY has been stuck between 154 and 156 the last two weeks and QQQ has bounced between 67.5 and 68.8 since the gap on March 5th. After edging higher on Wednesday, stocks gave it back on Thursday and edged lower... Read More
Art's Charts March 21, 2013 at 07:30 AM
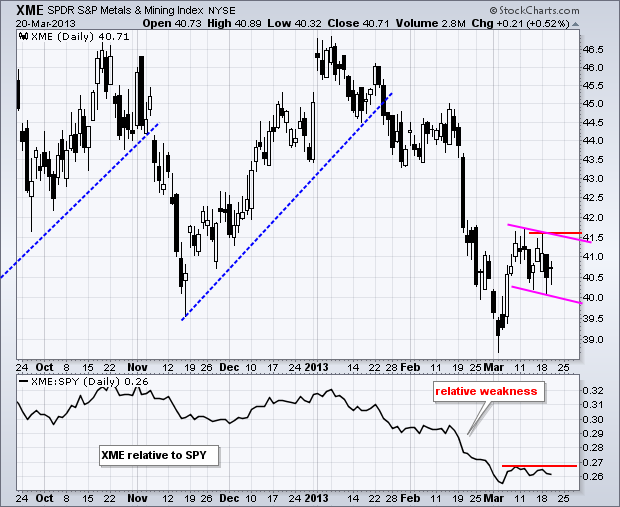
Stocks surged on the open and then moved into a relatively tight trading range. It is positive that the gains held, but lack of follow through suggests that the bulls are getting a little fatigued... Read More
Art's Charts March 21, 2013 at 06:34 AM
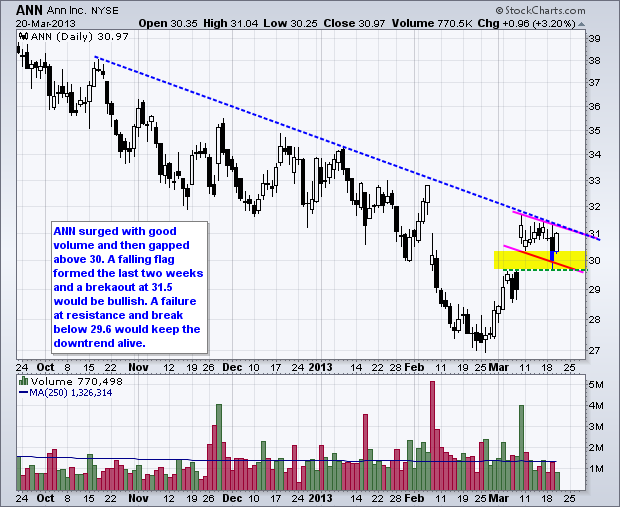
ANN Forms Flag Near Key Trend Line. APA Consolidates after Gap. Plus FNSR, IACI, LH, S, TE This commentary and charts-of-interest are designed to stimulate thinking. This analysis is not a recommendation to buy, sell, hold or sell short any security (stock ETF or otherwise)... Read More
Art's Charts March 20, 2013 at 09:02 AM
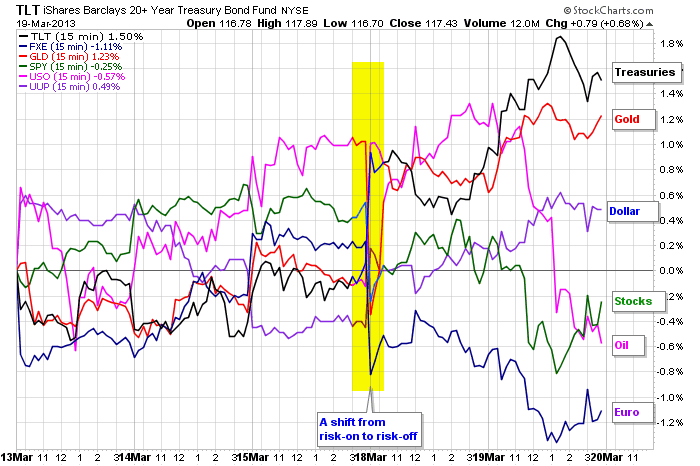
Let the volatility begin. The situation in Cyprus remains fluid and the news flow is providing a great excuse for volatility. Again, I do not think the situation in Cyprus will affect consumer spending and housing in the US... Read More
Art's Charts March 19, 2013 at 06:25 AM
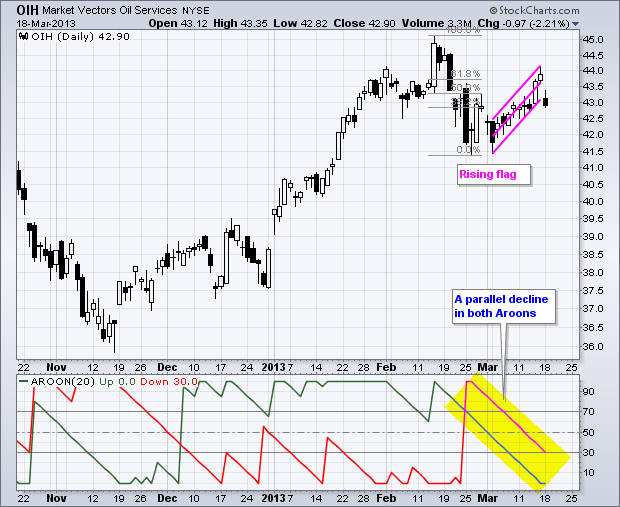
Stocks opened weak on news of the Cyprus bail-in plan, but quickly found their footing and bounced. Nevertheless, the major index ETFs ended the day with small losses. The Nasdaq 100 ETF (QQQ) held up well because Apple and Microsoft advanced... Read More
Art's Charts March 19, 2013 at 06:21 AM
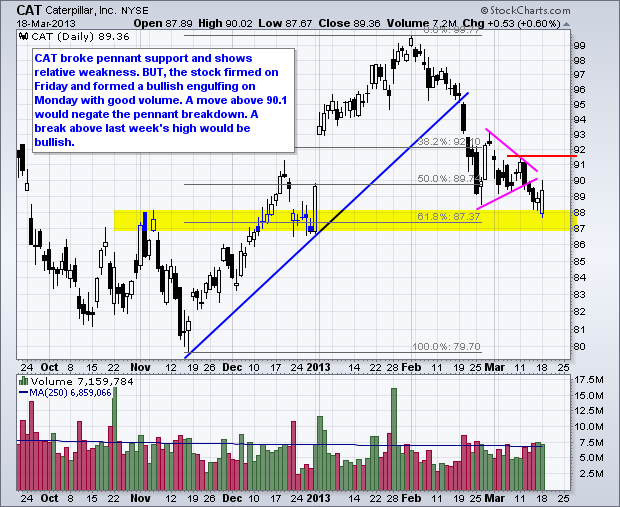
CAT Forms Engulfing Pattern at Key Retracement. CVC Firms at Long-term Support. Plus DANG, NTAP, RAI, TJX This commentary and charts-of-interest are designed to stimulate thinking... Read More
Art's Charts March 18, 2013 at 07:04 AM
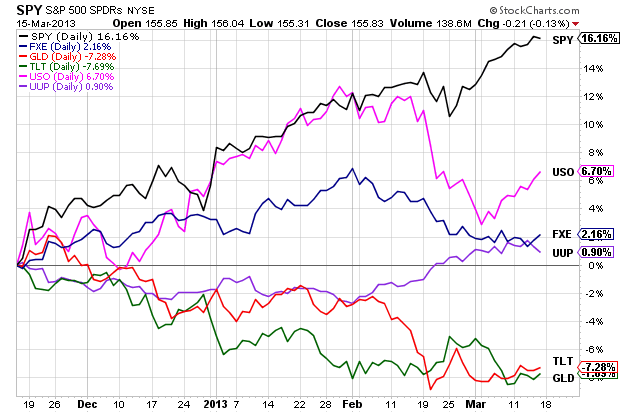
Look out below. Cyprus is getting the blame for today's move to risk-off. In short, the unprecedented decision to tax bank deposits in an EU country is putting the scare into markets. Cyprus is tiny, but the ramifications are being felt across the world today... Read More
Art's Charts March 15, 2013 at 08:08 AM
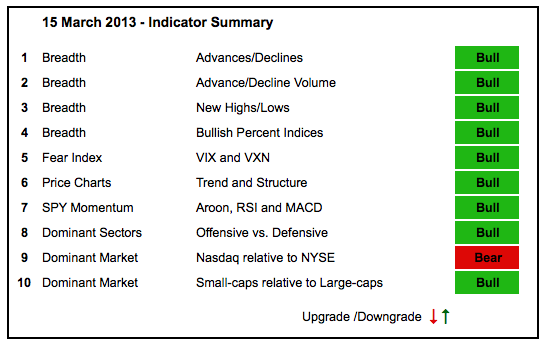
Stocks extended their March surged this week as the major index ETFs moved to new highs. The AD Lines and AD Volume Lines confirmed these moves with new highs of their own... Read More
Art's Charts March 15, 2013 at 06:53 AM
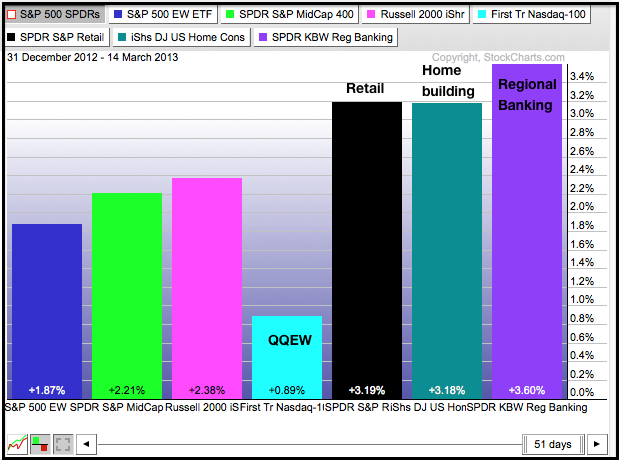
Stocks extended their gains on Thursday as the S&P 500 moved within spitting distance of its 2007 high. Small-caps led the way as the Russell 2000 ETF (IWM) surged 1%. All sectors were up, but their gains were muted... Read More
Art's Charts March 14, 2013 at 07:21 AM
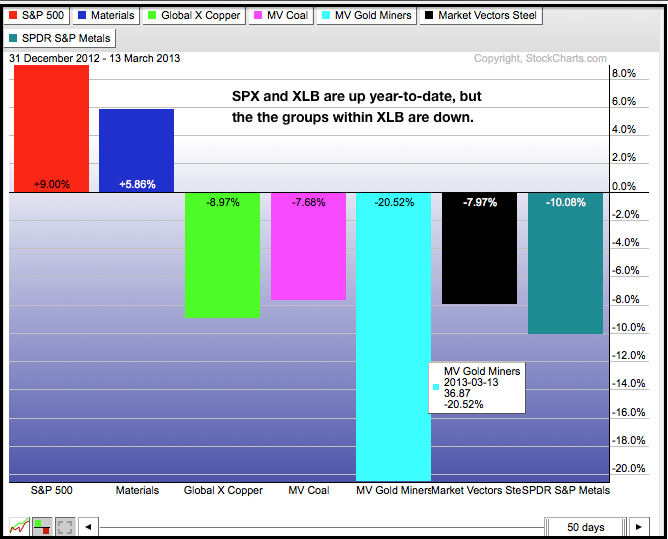
Boosted by a better-than-expected retail sales report, overbought stocks extended their advance with small gains. The major index ETFs were up fractionally with the S&P Small Cap iShares (+.55%) leading the way... Read More
Art's Charts March 14, 2013 at 06:52 AM
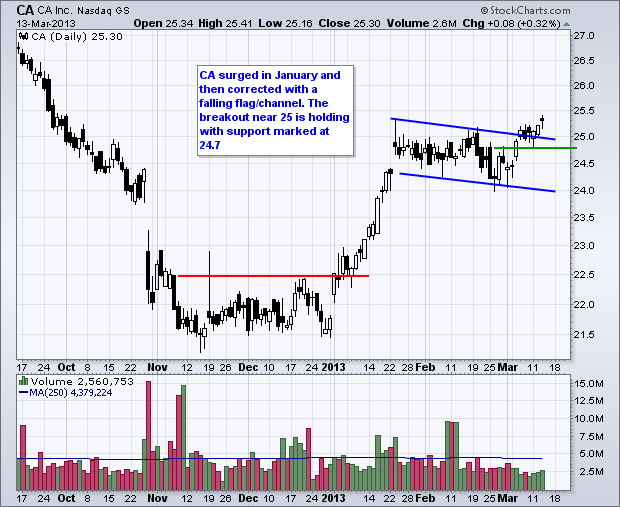
CA Consolidates after Breakout. CAT Confirms Bearish Continuation Pattern. Plus FB, GT, MAR, NBR This commentary and charts-of-interest are designed to stimulate thinking... Read More
Art's Charts March 13, 2013 at 05:04 AM
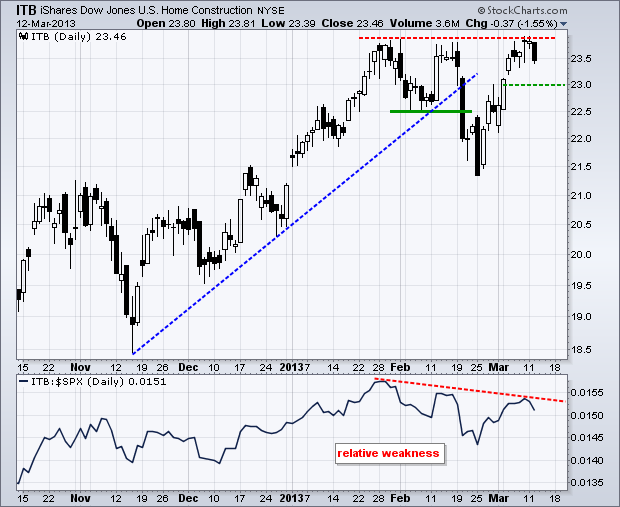
Stocks took a breather on Tuesday as the major index ETFs edged lower. The declines were small, very small. The sectors were mixed with the Basic Materials SPDR (XLB), Energy SPDR (XLE) and Healthcare SPDR (XLV) bucking the market and scoring small gains... Read More
Art's Charts March 12, 2013 at 06:46 AM
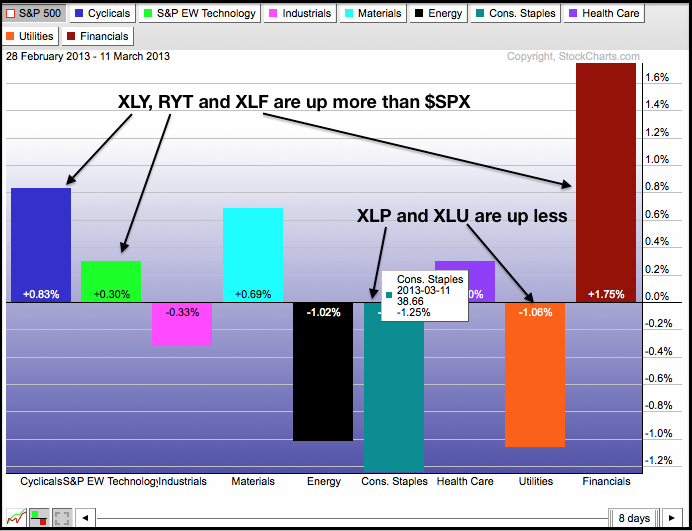
Stocks started the day weak with some selling pressure on the open, but quickly firmed as the major index ETFs worked their way higher the rest of the day. SPY and MDY closed near their highs for the day, which also happen to be 52-week highs... Read More
Art's Charts March 12, 2013 at 06:09 AM
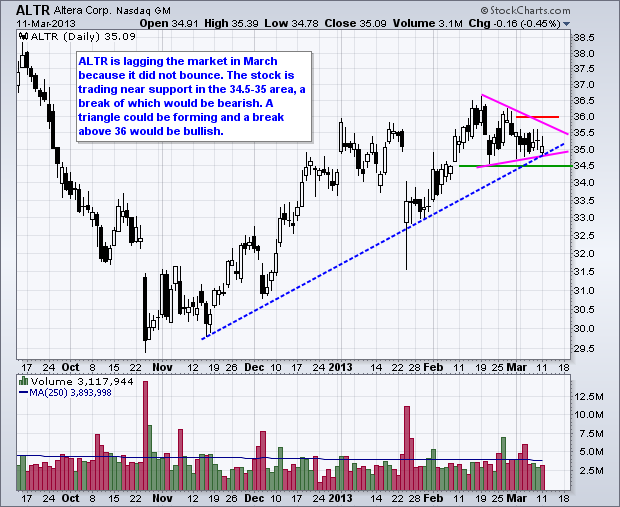
ALTR Consolidates near Trend Line Support. AMCC Bounces off Key Retracement. KSS, MRK and RDC This commentary and charts-of-interest are designed to stimulate thinking. This analysis is not a recommendation to buy, sell, hold or sell short any security (stock ETF or otherwise)... Read More
Art's Charts March 11, 2013 at 05:13 AM
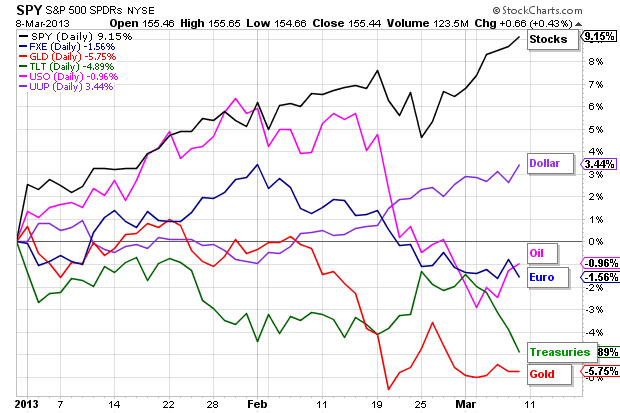
With a better-than-expected jobs report, stocks extended their gains on Friday and Treasuries dropped sharply. The S&P 500 ETF (SPY) hit another new high, while the 20+ Year T-Bond ETF (TLT) closed at its lowest level since May 2012... Read More
Art's Charts March 08, 2013 at 06:41 AM
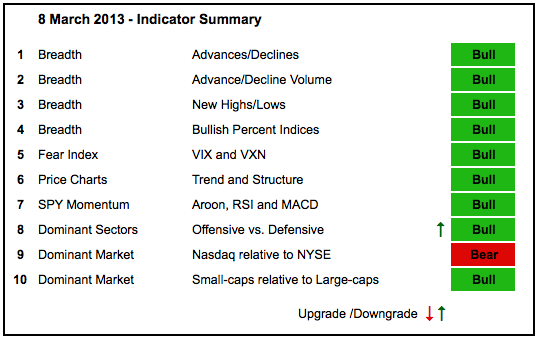
With a massive eight day surge, the major index ETFs moved to new highs and the offensive sectors got back in gear. The AD Lines and AD Volume Lines also moved to new highs, and Net New Highs expanded once again... Read More
Art's Charts March 08, 2013 at 05:48 AM
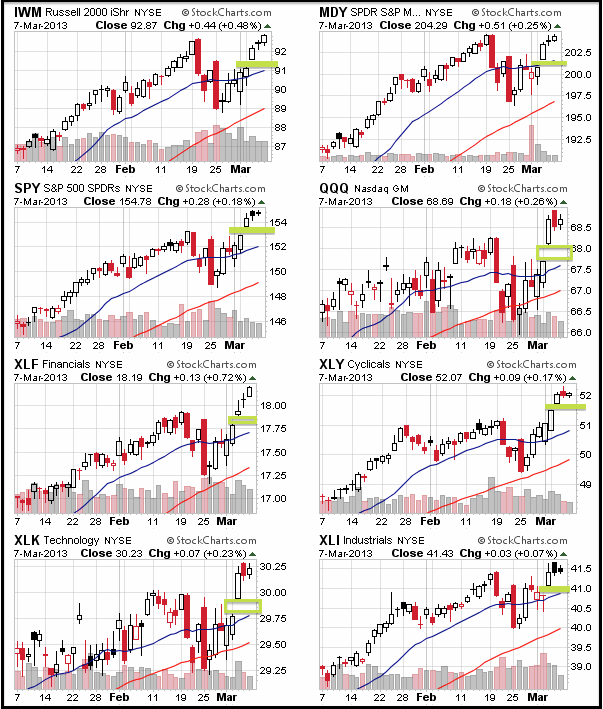
Stocks continued on their merry Thursday with the Russell 2000 ETF (IWM) leading the way (+.61%). Note that IMW is up eight days straight... Read More
Art's Charts March 07, 2013 at 06:37 AM
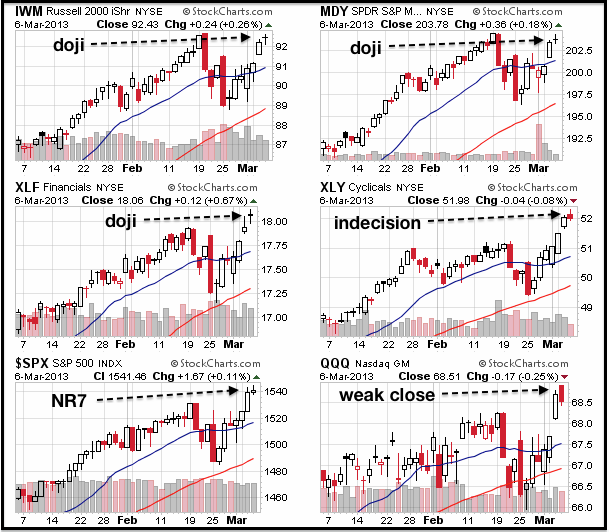
After big moves on Tuesday, stocks took a breather on Wednesday as the major index ETFs consolidated. The Dow SPDR (DIA) edged higher, while the Nasdaq 100 ETF (QQQ) edged lower... Read More
Art's Charts March 07, 2013 at 06:30 AM
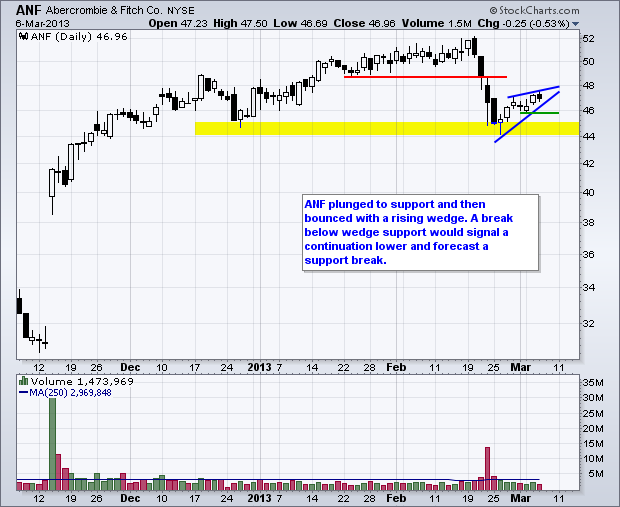
ANF Bounces off Support with Rising Wedge. BRBR Breaks Resistance with Surging Volume. Plus BRCM, DNDN, HSL This commentary and charts-of-interest are designed to stimulate thinking... Read More
Art's Charts March 06, 2013 at 04:11 AM
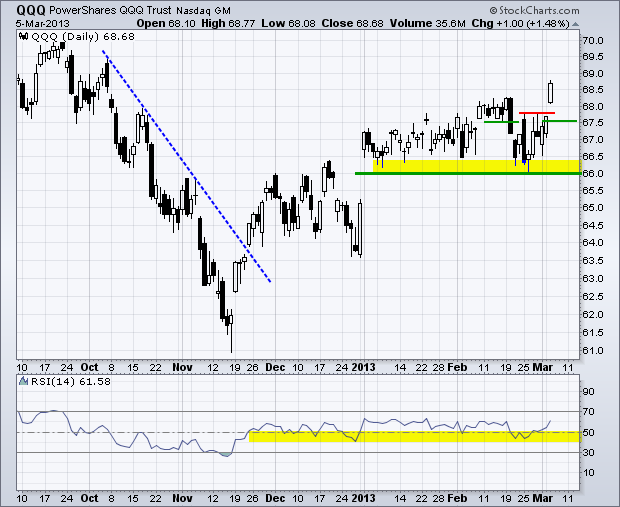
Stocks surged out of the gate with big gains in the first 30 minutes. The ISM Services Index beat expectations at 10AM and this kept the bid in stocks for the rest of the day. The major index ETFs finished the day with gains ranging from .90% for the Dow SPDR (DIA) to 1... Read More
Art's Charts March 05, 2013 at 05:18 AM
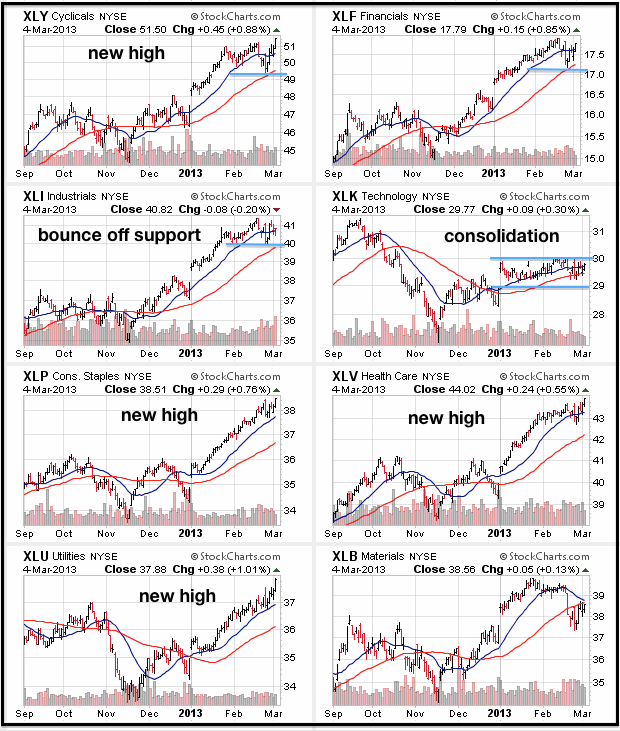
You have to give the bulls credit for resilience. Stocks treaded water in the early going and then surged in the afternoon. The major index ETFs closed at or near their highs for the day... Read More
Art's Charts March 05, 2013 at 05:13 AM
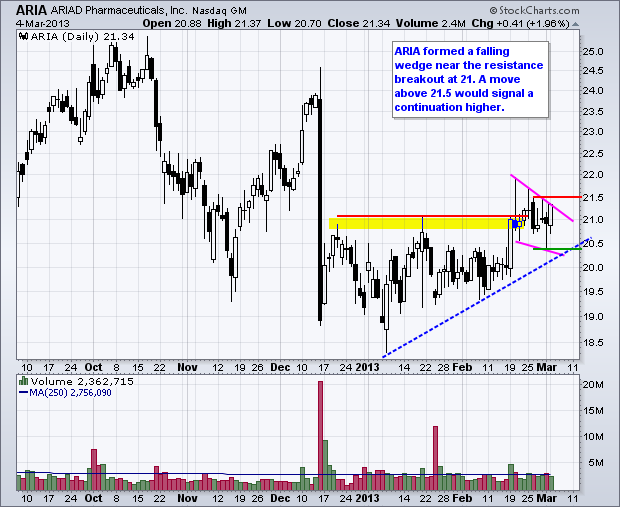
ARIA Forms Bull Wedge Near Breakout. CTXS Bounces off Gap Support Zone. Plus BBBY, CTXS, F, PCS This commentary and charts-of-interest are designed to stimulate thinking. This analysis is not a recommendation to buy, sell, hold or sell short any security (stock ETF or otherwise)... Read More
Art's Charts March 04, 2013 at 06:53 AM
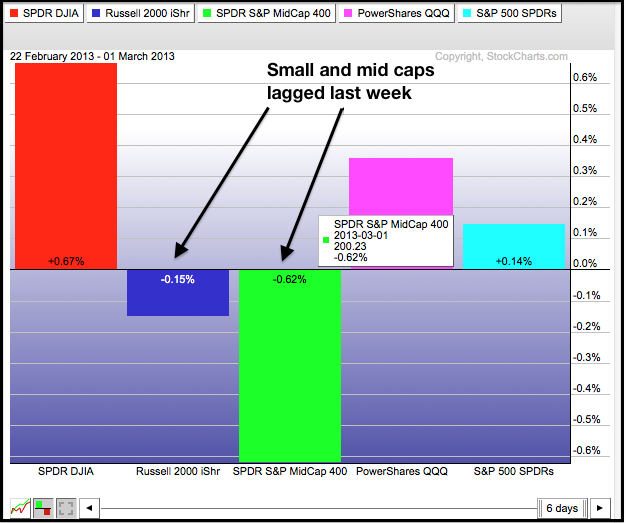
On a closing basis, the Dow SPDR (DIA) closed the week at its highest level in years. Even though Friday's intraday high did not exceed Thursday's intraday high, Friday's close was significant for DIA and the Dow Industrials... Read More
Art's Charts March 01, 2013 at 05:18 AM
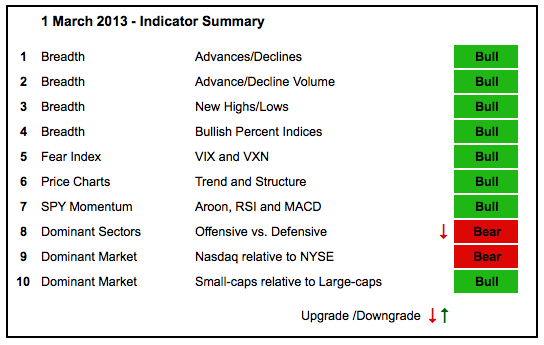
The majority of indicators remain bullish, but offensive sector performance got a downtrend. The technology and consumer discretionary sectors underperformed in February, but the finance and industrials sectors outperformed... Read More
Art's Charts March 01, 2013 at 04:13 AM
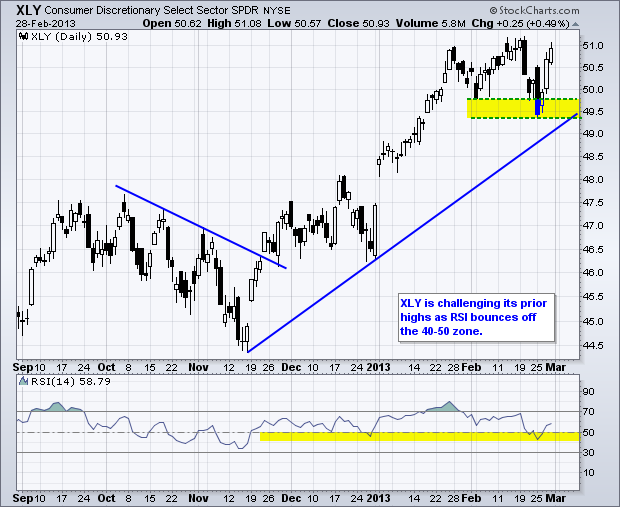
Stocks were strong in the first half of the day, but sold off in the second half, especially in the last hour. The Dow came within 15 points of its all time high and then fell over 90 points with the afternoon sell off. The senior average closed near its low for the day... Read More