 Follow Through Day or Not? Stocks started Friday with a bang as the S&P 500 SPDR (SPY) gapped above 296 and held this gap throughout the day, despite a sell off in the final 30 minutes. Does this count as a "follow through" day? It is certainly enough to reverse the short-term downtrend because there is a break above the red resistance zone on the chart below. And, SPY gained the last three days to follow through on the prior week's reversal. Thus, I would suggest that it is a follow through day until proven otherwise. So what would it take to prove otherwise?
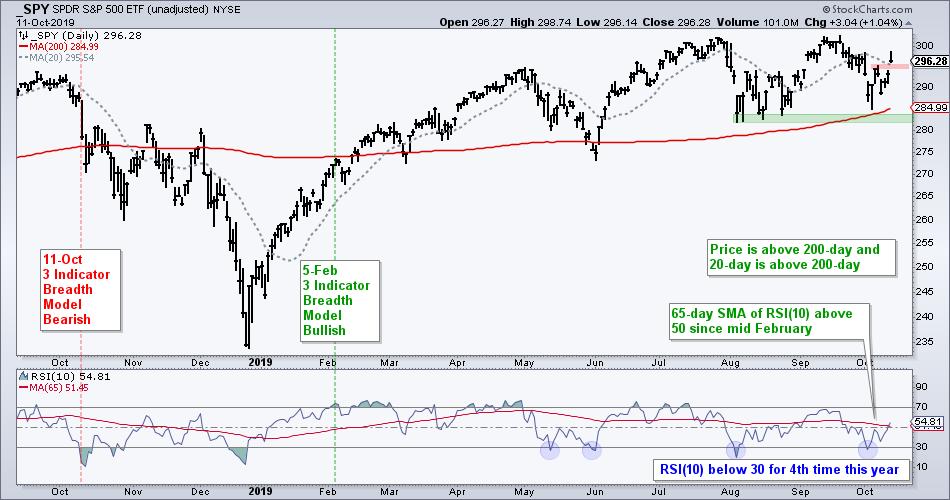
Before looking at the short-term situation, keep in mind that the long-term trend is up, and has been up since February. The trend details were covered in Friday's State of the Stock Market Report. Note that SPY held above the August lows and rising 200-day SMA in early October. A break below the August-October lows would prove this uptrend otherwise. Also, note that SPY is just 2% from an all time high.
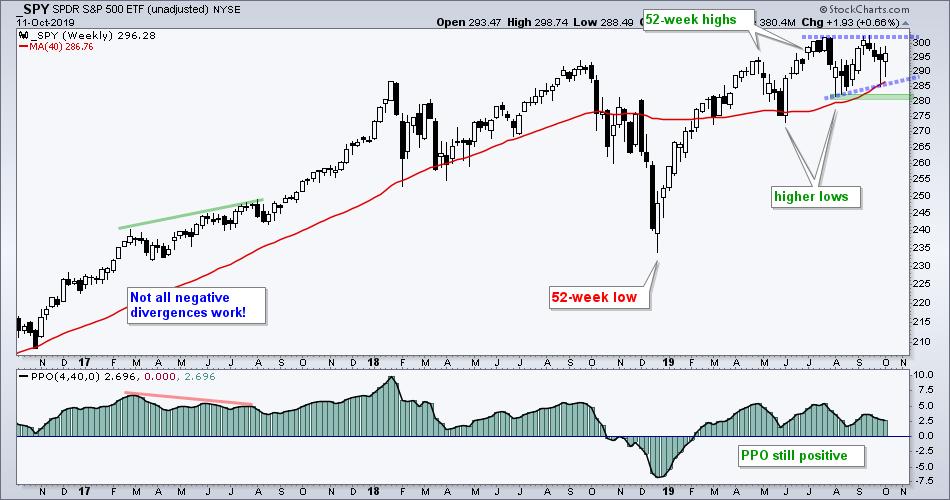
The chart below shows weekly candles with a clear uptrend in progress. SPY is above the rising 40-week SMA, the ETF hit new highs this summer and could be forming a higher low from August to October. Thus, a possible ascending triangle could be forming over the last few months.
I rarely use intraday charts, but will use a 15min bar chart to highlight the recent breakout and set the key levels. SPY plunged below a support zone in early August and then rallied back to this zone. Broken support turned into resistance and the ETF then gapped down on October 8th. This gap did not last long as the ETF moved higher the last three days and broke above resistance.
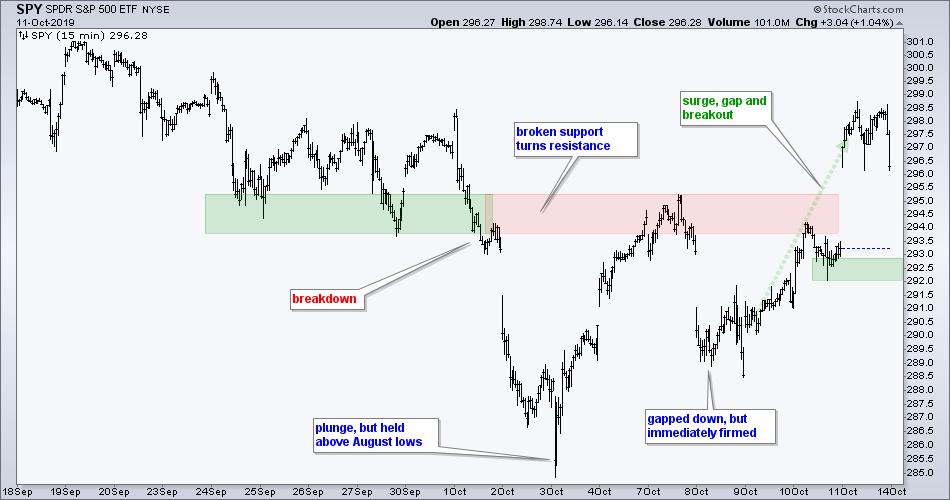
Despite a sell off in the last 30 minutes on Friday, the gap and the breakout are holding. Ideally, a follow through day would sport a breakout, further strength during the day and a strong finish. Well, we got one of the three (the breakout). In addition, SPY closed 1% higher on the day.
At this point, the cup is half full with the gap zone holding the first key. A close below 292 would negate this follow through day and reverse the short-term uptrend. This could set up a test of key support, but let's cross that bridge when/if it gets here.
Also note that the five offensive sectors held their August lows here in October and broke short-term resistance levels that were set in Thursday's commentary (ETF Ranking and Grouping).
------------------------------------------------------------
This Week on Art's Charts
Saturday - October 12: Eight Stock Setups for the Coming Week - ATVI, IDXX, SRCL, CF, ITW, BBY, FISV, LPSN
Friday - October 11: The State of the Stock Market - Key Assumptions Determine Probabilities - Index and Sector Breadth Model - Fed Assets
Thursday - October 10: Ranking and Grouping ETFs - Key Large-cap ETFs at Moment of Truth - Many More Downtrends than Uptrends
------------------------------------------------------------
Choose a Strategy, Develop a Plan and Follow a Process
Arthur Hill, CMT
Chief Technical Strategist, TrendInvestorPro.com
Author, Define the Trend and Trade the Trend
Want to stay up to date with Arthur's latest market insights?
– Follow @ArthurHill on Twitter


