ChartWatchers February 21, 2009 at 10:44 PM
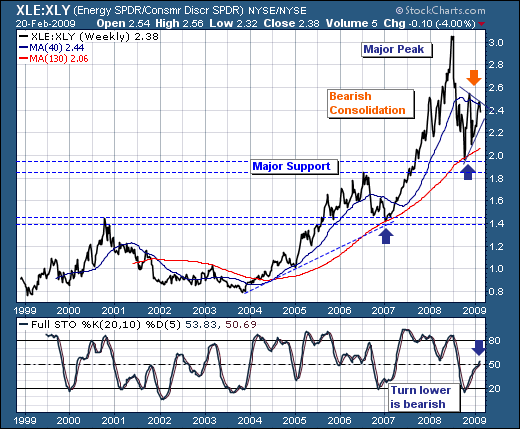
In our last commentary, we noted that the S&P Energy ETF (XLE) was in the process of forming a bearish consolidation that argues for sharply lower prices... Read More
ChartWatchers February 21, 2009 at 09:41 PM
In case you missed it, we are now publishing a ton of new content about charting and technical analysis on our seven(!) different blogs. One of the great things about blogs is that you can "subscribe" to a blog and then get notified as soon as anything new is posted... Read More
ChartWatchers February 21, 2009 at 01:56 PM
I receive a lot of questions regarding the "ultra" shares and "ultrashort" shares and how to effectively trade them. In particular, there are always questions asking why those "juiced" ETF returns don't correspond to the indices they're supposed to track over time... Read More
ChartWatchers February 21, 2009 at 01:51 PM
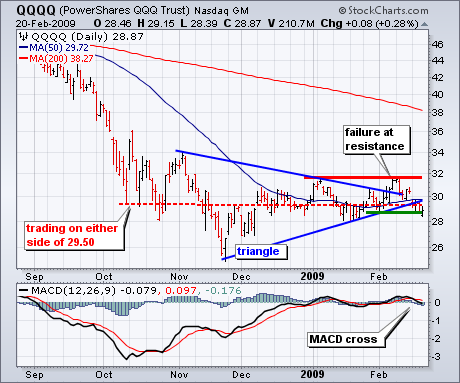
Two weeks ago I featured the Nasdaq 100 ETF (QQQQ) with a triangle breakout, strong OBV and relative strength. The ETF surged to resistance from the early January high, but ultimately failed to break above this key level... Read More
ChartWatchers February 20, 2009 at 09:42 PM
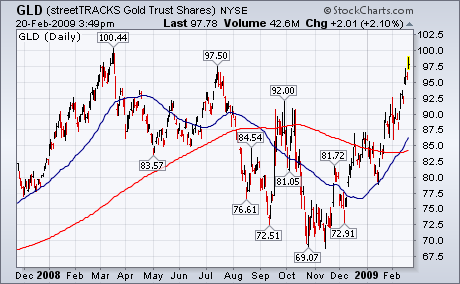
GOLD TOUCHES $1000 FOR FIRST TIME IN A YEAR... A number of financial markets are testing important chart points. Let's start with gold. Bullion touched $1,000 today for the first time since last March... Read More
ChartWatchers February 20, 2009 at 09:17 PM
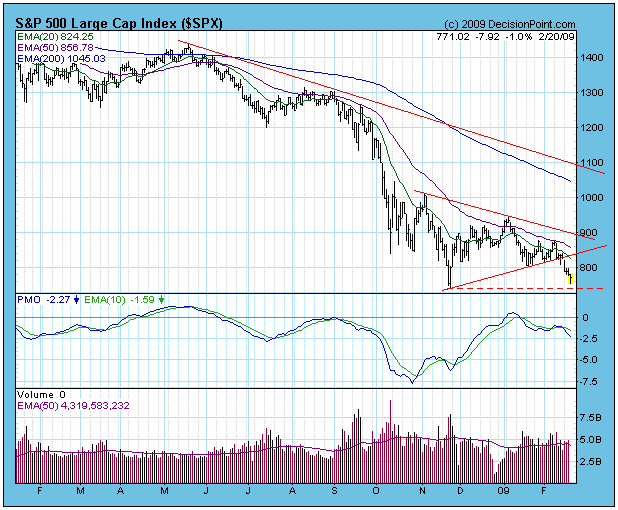
The long-awaited retest of the November lows has finally arrived. The S&P 500 is still slightly above that support, but the Dow has penetrated it... Read More
ChartWatchers February 20, 2009 at 09:00 PM
This is the second part of a series of articles about Technical Analysis from a new course we're developing. If you are new to charting, these articles will give you the "big picture" behind the charts on our site... Read More
ChartWatchers February 07, 2009 at 10:35 PM
Hello Fellow ChartWatchers! This week is the start of big changes here at StockCharts.com. We are moving much of our free content over into a new set of Blogs. ("Blogs" are Web Logs - collections of articles on a particular topic... Read More
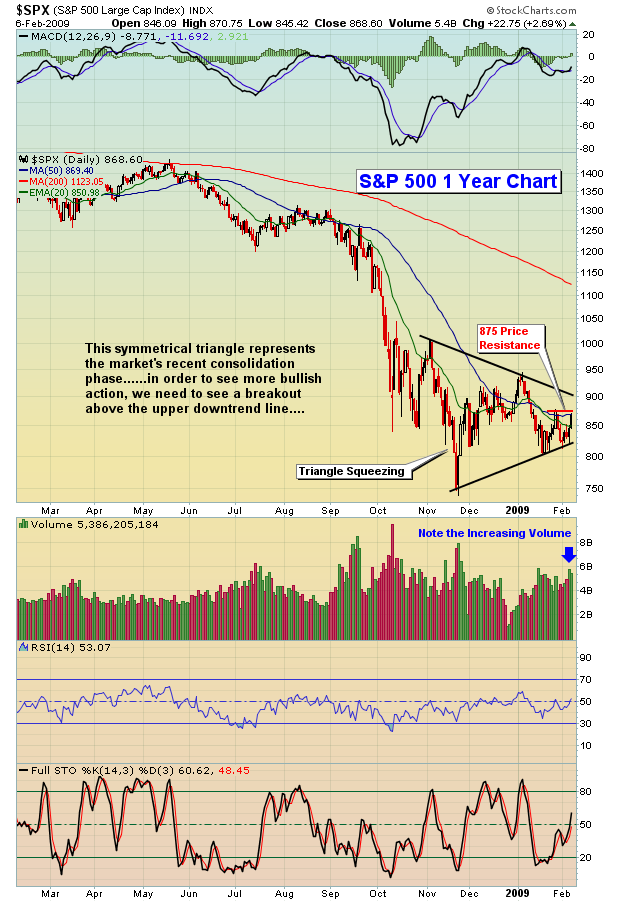
ChartWatchers February 07, 2009 at 10:34 PM
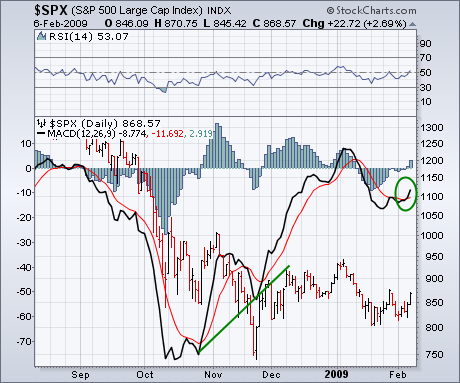
A reader complained this week that we failed to point out the "negative divergence" in the daily MACD lines during January prior to the latest downturn. The reason I didn't point it out was because none existed. In fact, it may be the other way around... Read More
ChartWatchers February 07, 2009 at 10:30 PM
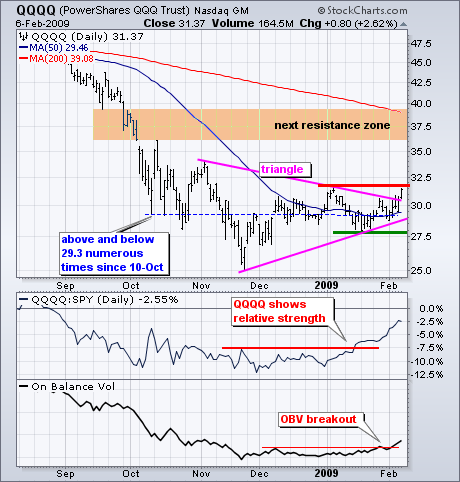
The Nasdaq 100 ETF (QQQQ) is breaking out of its trading range. The chart below shows QQQQ stuck in a trading since 10-Oct. Focusing on the blue dotted line marking the mid October lows, we can see that QQQQ traded above and below this line numerous times the last four months... Read More
ChartWatchers February 07, 2009 at 08:21 PM
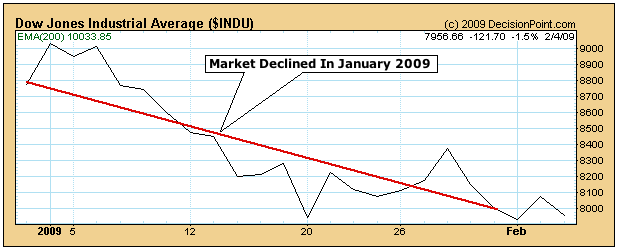
Research published by Yale Hirsch in the "Trader's Almanac" shows that market performance during the month of January often predicts market performance for the entire year... Read More
ChartWatchers February 07, 2009 at 02:55 PM
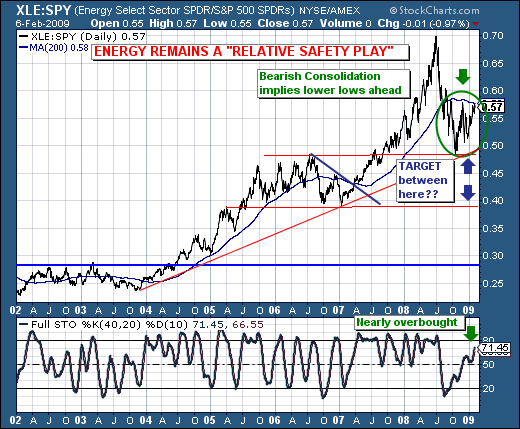
Our focus today is upon the Energy Sector (XLE) and its relative valuation to the S&P 500 Spyders (SPY)... Read More
ChartWatchers February 07, 2009 at 02:49 PM
We've seen this all before. The sure-fire short setups get waxed as trendline support holds. Then the bulls grow confident as the market soars only to get turned back by trendline resistance. The cycle continues to repeat itself until we get resolution... Read More