ChartWatchers January 19, 2009 at 01:16 AM
This is the first part of a series of articles about Technical Analysis from a new course we're developing. If you are new to charting, these articles will give you the "big picture" behind the charts on our site... Read More
ChartWatchers January 18, 2009 at 10:12 AM
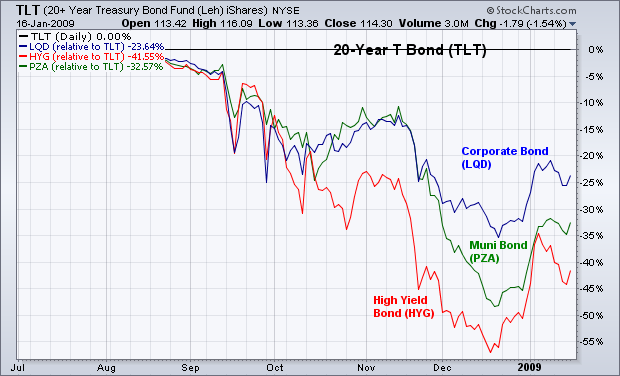
I recently wrote about how investment grade corporate bonds were starting to gain some ground on Treasury bonds. Today, I'm adding two other bond categories to that list... Read More
ChartWatchers January 18, 2009 at 02:25 AM
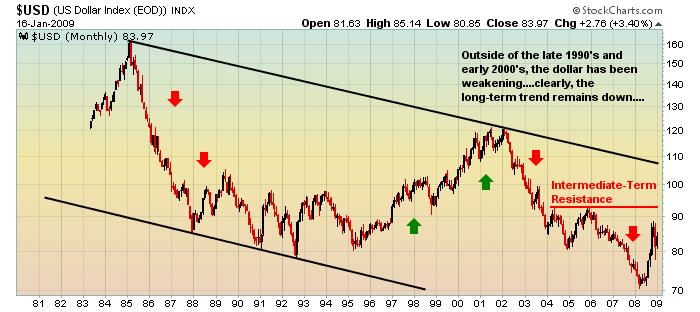
An interesting result of the government bailout of the financials and automakers, along with the huge economic stimulus package will be the long-term impact on the U.S. dollar... Read More
ChartWatchers January 18, 2009 at 02:20 AM
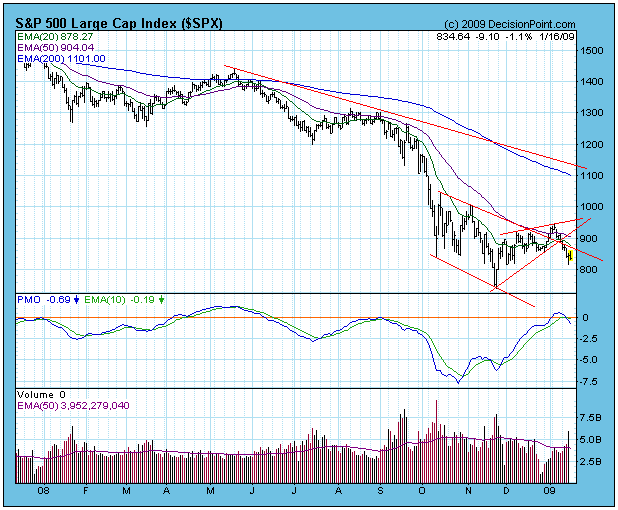
In my January 2 article I pointed out that the stock market was overbought by bear market standards, but that the rally had plenty of internal room for prices to expand upward if bullish forces were to persist... Read More
ChartWatchers January 18, 2009 at 02:16 AM
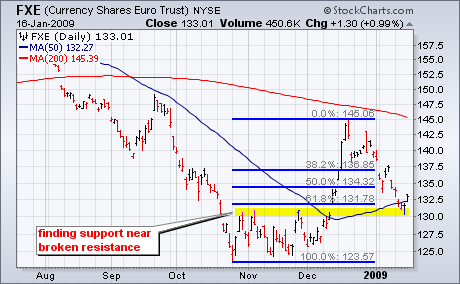
With a bounce on Friday, the Euro Trust ETF (FXE) found support from a confluence of indicators and chart features. First, broken resistance turns into support in 130-132 area. Second, there is support in this area from the 50-day moving average... Read More
ChartWatchers January 04, 2009 at 11:05 PM
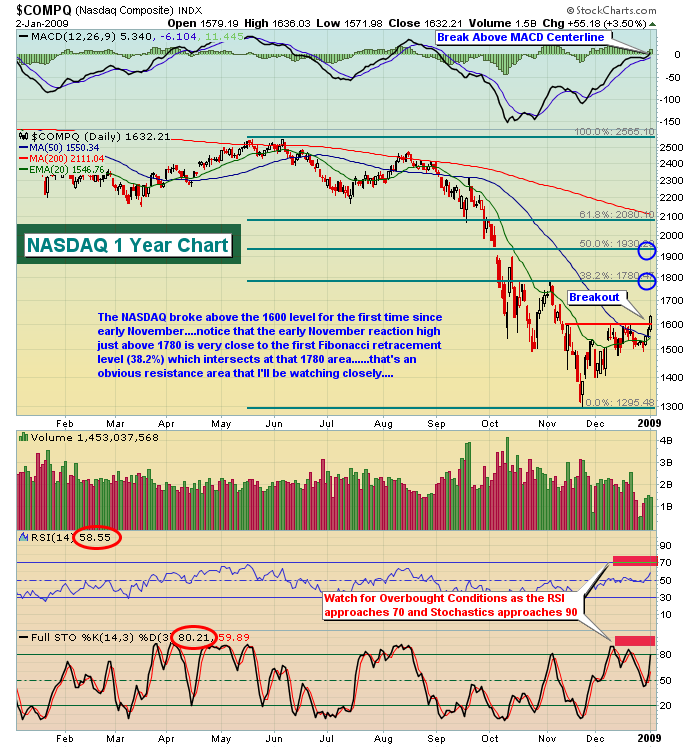
In order to gain a decent perspective as to where we might go in 2009, it's always helpful to take a look at the past to see how we got here. 2008 was a horrible year for the major stock market indices. The Dow Jones, S&P 500, NASDAQ and Russell 2000 lost 33.84%, 38.49%, 40... Read More
ChartWatchers January 04, 2009 at 11:04 PM
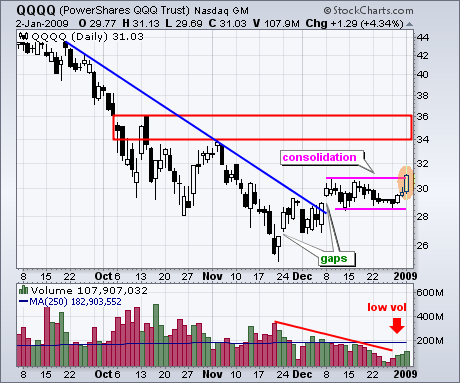
QQQQ broke consolidation resistance with a big surge on the first trading day of the year. After surging in late November and early December with two gaps, QQQQ stalled for most of December with a flat trading range... Read More
ChartWatchers January 04, 2009 at 11:03 PM
For the last few weeks the stock market has been drifting higher on low volume, and there is no doubt in my mind that the Fed/Treasury has been the invisible hand that has quickly moved in to squelch any selling that started... Read More
ChartWatchers January 04, 2009 at 11:02 PM
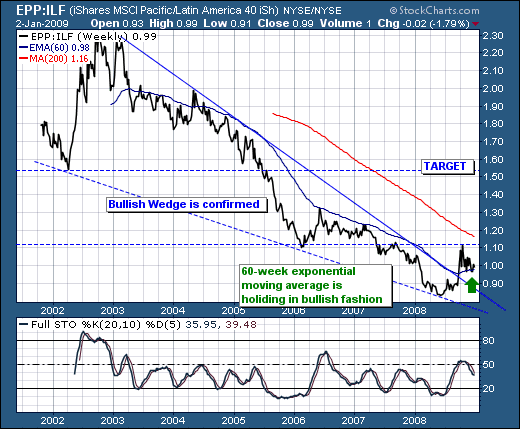
As the credit crisis continues apace into 2009, we believe the time is rather "ripe" for pursuing various hedging "thematic" strategies to profit from relative valuations across the globe... Read More
ChartWatchers January 04, 2009 at 11:01 PM
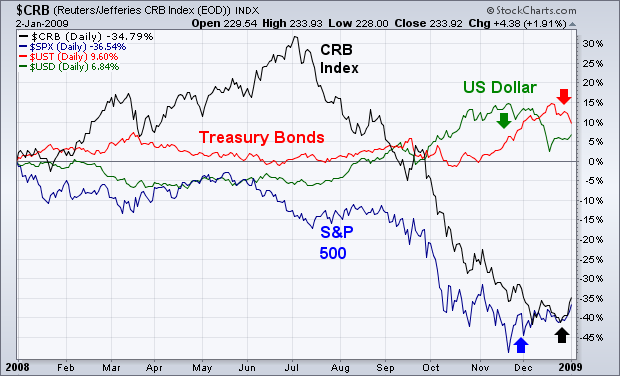
Chart 1 shows how the interaction between the four main asset classes unfolded during 2008 and how they're entering 2009. The two weakest assets were commodities and stocks. The two strongest were Treasury bonds and the dollar... Read More
ChartWatchers January 04, 2009 at 11:00 PM
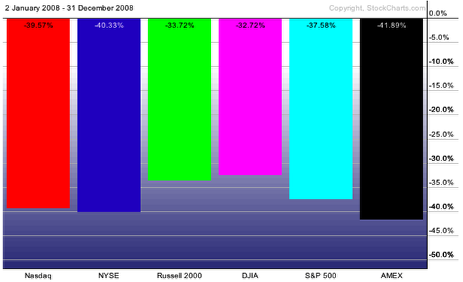
Hello Fellow ChartWatchers! First off, Happy 2009! Let's hope this year is better than 2008 - one of the all time stinkers in terms of stock market performace. How bad was it? Here ya go: Ugh. Well, let's not dwell on it too much... Read More