ChartWatchers June 15, 2013 at 04:39 PM
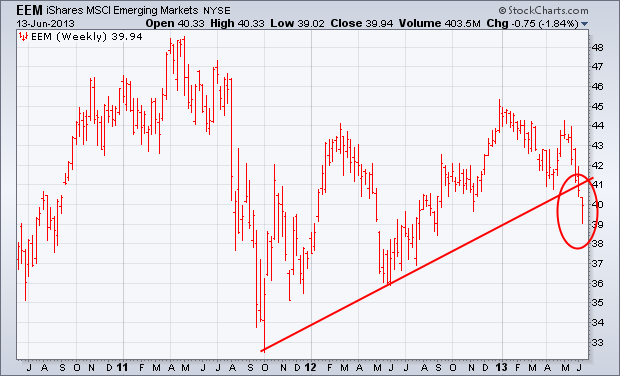
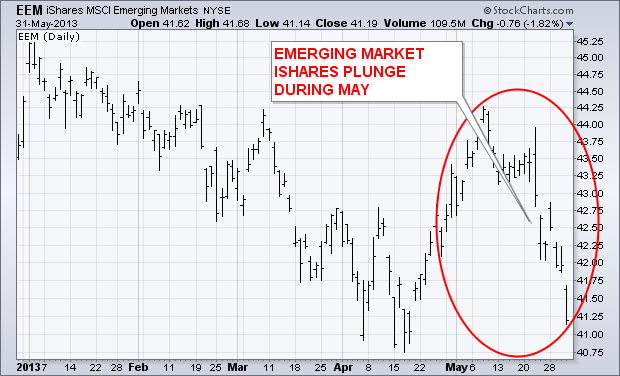
The biggest threat to the global stock rally is coming from emerging markets. The weekly bars in the chart below show Emerging Market iShares (EEM) falling to the lowest level in nine months. It has also broken a support line extending back to the fourth quarter of 2011... Read More
ChartWatchers June 15, 2013 at 03:24 PM
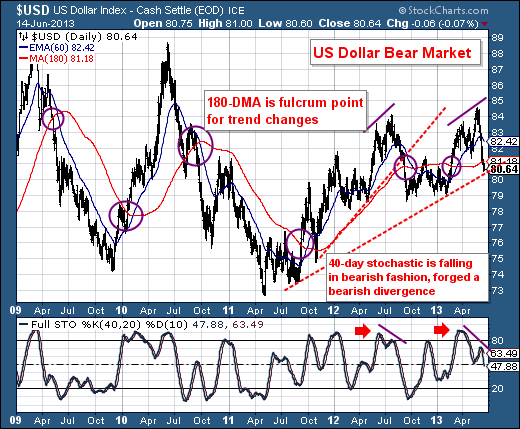
The US Dollar has declined rather sharply over the past 2-weeks, which given the scope of the decline - has likely pushed it into a bear market... Read More
ChartWatchers June 15, 2013 at 03:20 PM
Volatility plays a role in any market environment, but I always look to key areas of resistance on the VIX to help identify tradable bottoms on the S&P 500. In my last article on June 1st, I suggested that the 18-19 resistance on the VIX could prove to be key... Read More
ChartWatchers June 15, 2013 at 03:15 PM
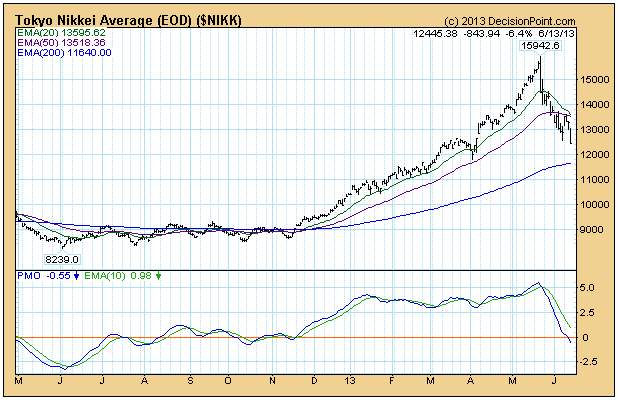
The Tokyo Nikkei Average has been in another free-fall since the top in May, falling -22%. Before we get to the long-term chart, let's look at the one-year daily bar chart. The average rose +82% in just six months in a parabolic move that was doomed from the start... Read More
ChartWatchers June 15, 2013 at 01:07 PM
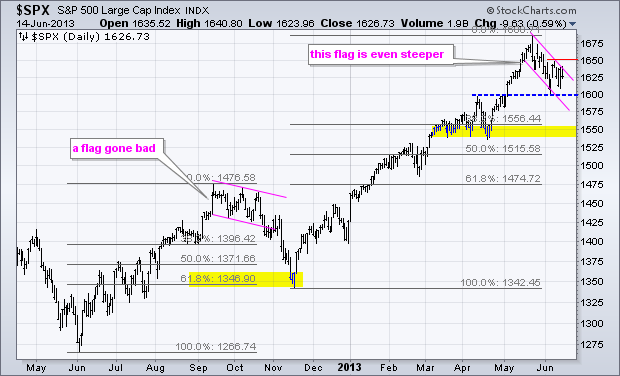
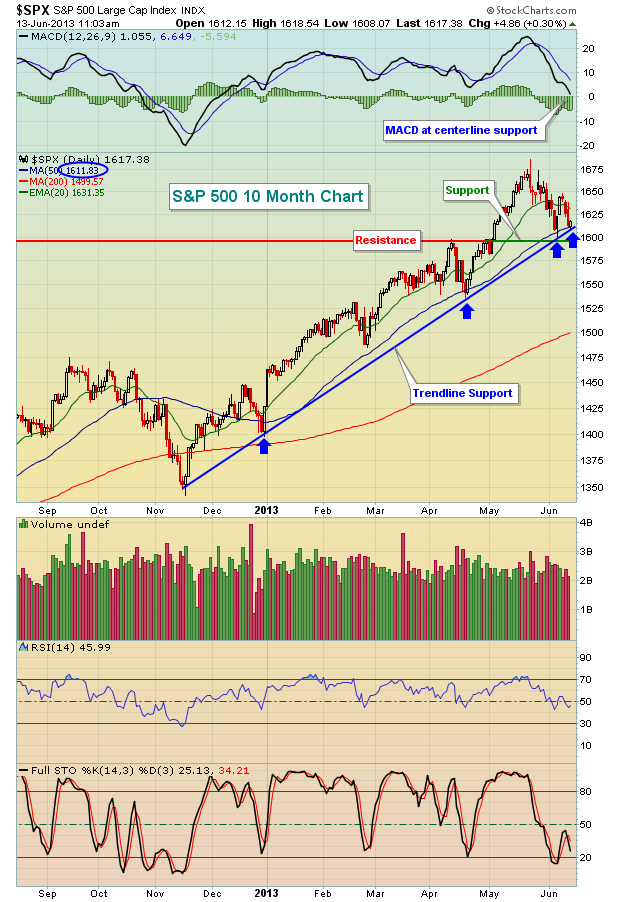
The S&P 500 got a two day bounce last week and a nice surge on Thursday, but fell back Friday as it met resistance at 1650, which is now the short-term level to beat. Overall, notice that the index formed a falling flag type correction the last four weeks... Read More
ChartWatchers June 14, 2013 at 09:00 PM
Hello Fellow ChartWatchers! GalleryView has been a often overlooked gem here at StockCharts going all the way back to the beginning of the website... Read More
ChartWatchers June 02, 2013 at 02:06 AM
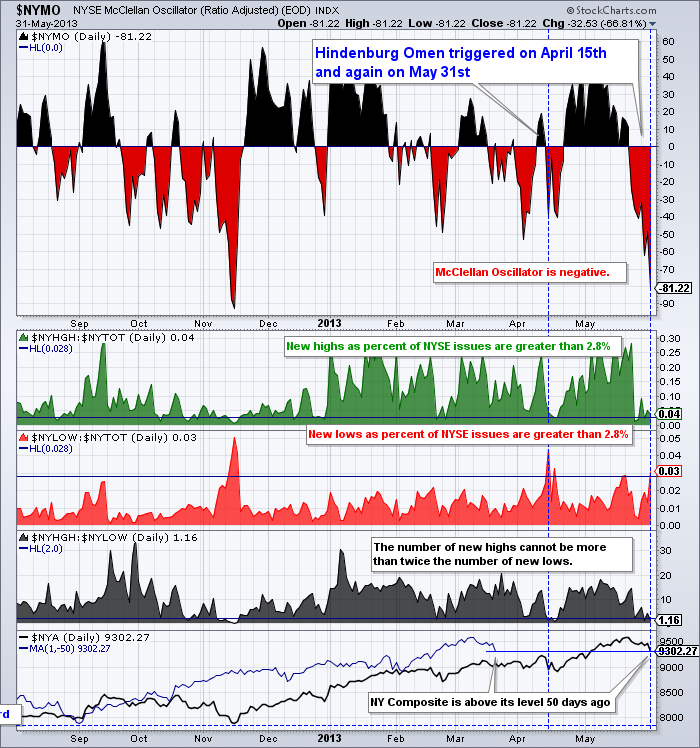
Hello Fellow ChartWatchers! It happened in mid-April and it happend again on the last day of May. The ominous sounding "Hindenburg Omen" signal has been given. Here's the chart: StockCharts members can click here for a live version of this chart... Read More
ChartWatchers June 01, 2013 at 10:22 PM
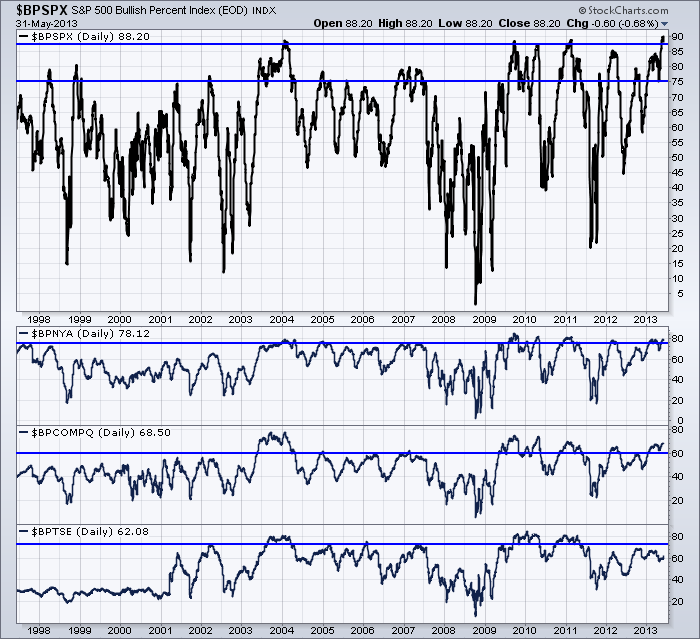
Some of the most powerful,informative gauges of sentiment towards the market are the Bullish Percent Indexes. If you are not familiar with them, you can read about them here by clicking on this link... Read More
ChartWatchers June 01, 2013 at 10:10 PM
The main story of the past week has been the upside breakout in U.S. Treasury bond yields to the highest level in thirteen months, and the corresponding drop in bond prices... Read More
ChartWatchers June 01, 2013 at 09:55 PM

That's the bad news. The good news is that momentum issues are more of a short-term nature than a long-term one. Still, as traders, we need to respect them just the same... Read More
ChartWatchers June 01, 2013 at 06:18 AM
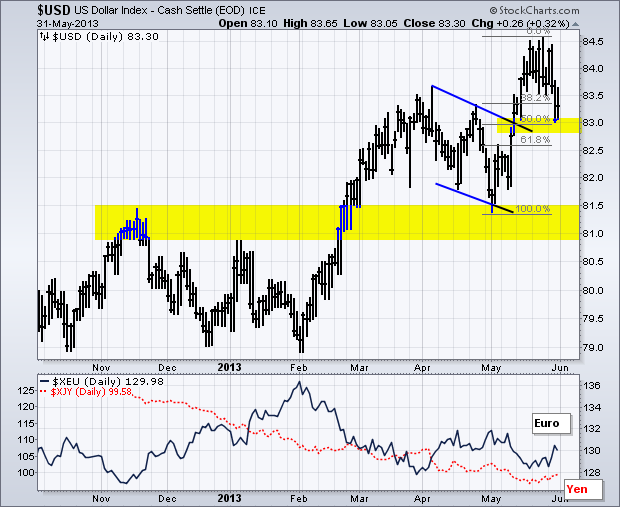
The US Dollar Index ($USD) is in a long-term uptrend, but the index pulled back this week to test the most recent breakout. A strong breakout should hold, while a weak breakout would fold. This is am important test for the greenback as we head into a big economic reporting week... Read More
ChartWatchers May 31, 2013 at 08:39 PM
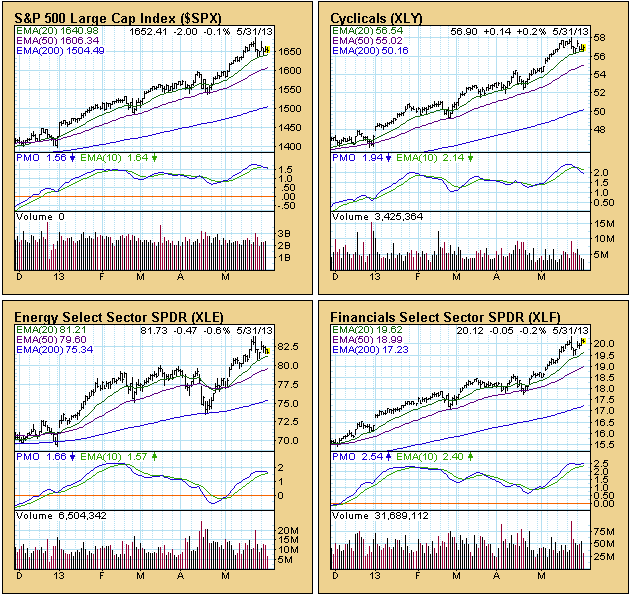
The S&P 500 component stocks are divided into nine sectors. All the stocks are used, and each stock is only used once. Those sector indexes are typically tracked using the nine SPDRs, which are essentially ETFs that whereby the sectors can be traded... Read More