ChartWatchers September 22, 2013 at 10:49 AM
Hello Fellow ChartWatchers! We've just complete a terrific visit to the New York area where we held our two day SCU seminars and where I was able to squeeze in a visit to the Long Island Stock Traders Meetup Group... Read More
ChartWatchers September 21, 2013 at 02:31 PM
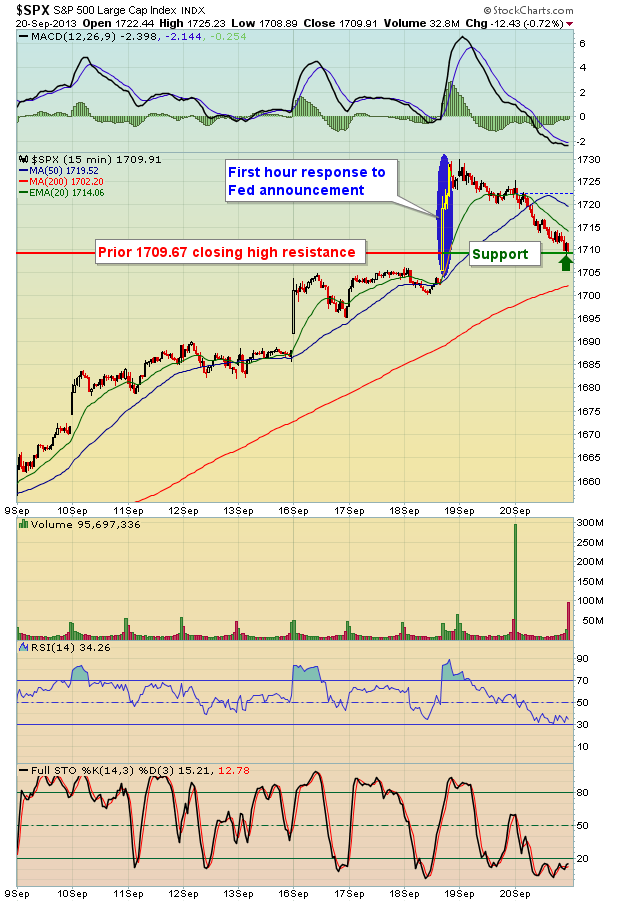
Federal Reserve Chairman Ben Bernanke has had several mandates since the financial crisis began several years ago. One was to keep interest rates extraordinarily low for an extended period of time. Check. Another was to make the Fed more transparent... Read More
ChartWatchers September 21, 2013 at 02:12 PM
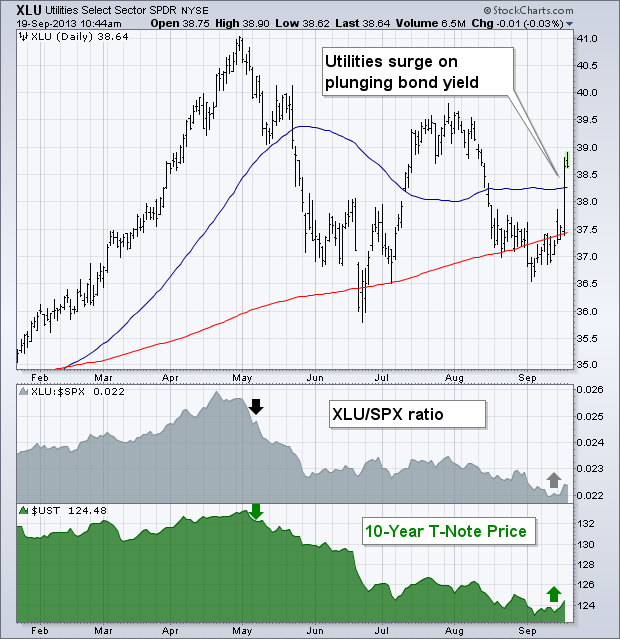
The Fed surprised everyone yesterday by deciding not to start its widely anticipated tapering of bond purchases. Although that decision was a surprise, market reactions weren't. In fact, each market did pretty much was one would expect. Bond yields tumbled and bond prices soared... Read More
ChartWatchers September 21, 2013 at 02:08 PM
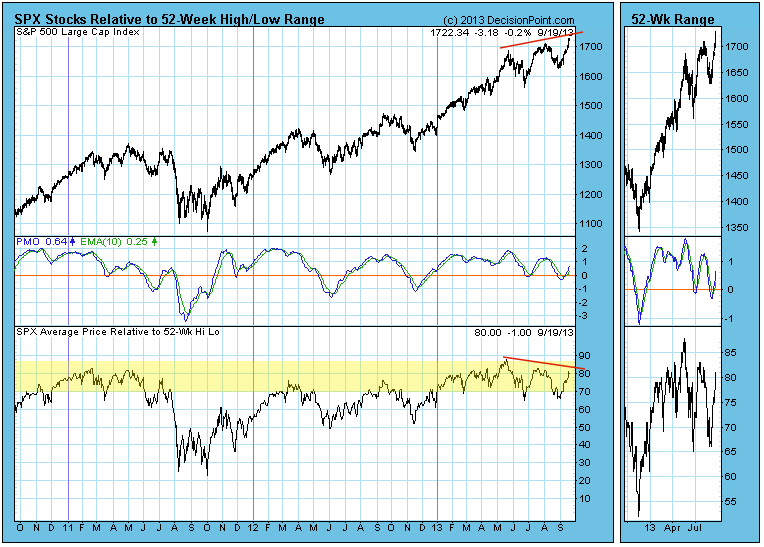
When looking at a chart that shows new 52-week highs and lows, have you ever wondered what is happening with all the other stocks in the index? Where are they in relation to their 52-week high-low range? DecisionPoint.com's "Rel-to-52" index provides that answer. DecisionPoint... Read More
ChartWatchers September 21, 2013 at 10:44 AM
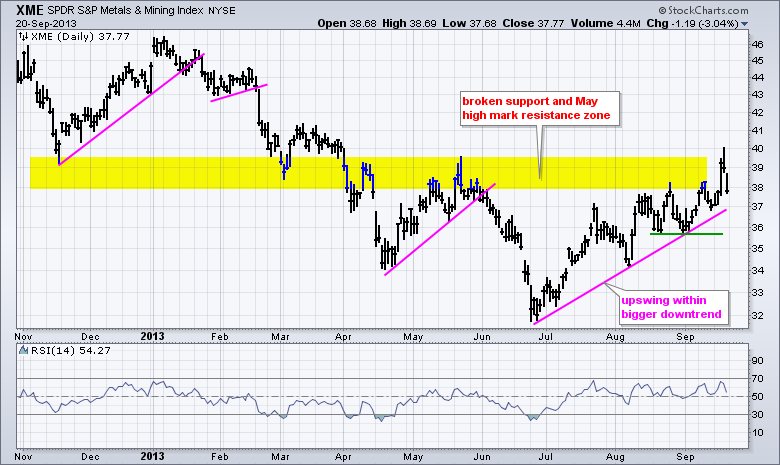
After bottoming in late June and advancing some 15%, the Metals & Mining SPDR (XME) hit resistance in the 39 area with a pop-and-drop this week... Read More
ChartWatchers September 07, 2013 at 04:30 PM
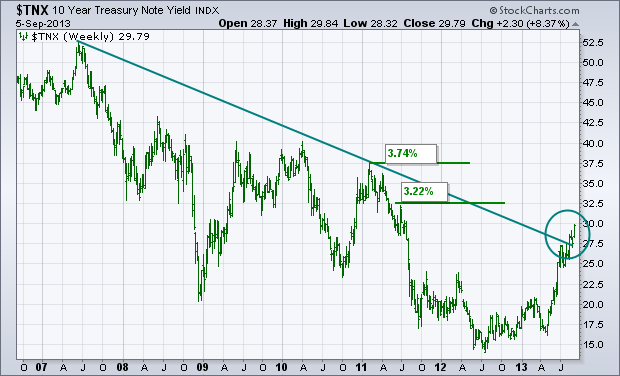
The weekly bars in Chart 1 show the 10-Year Treasury Note Yield ($TNX) reaching a new two-year high today and very close to breaching the psychologally important 3% barrier for the first time since early 2011... Read More
ChartWatchers September 07, 2013 at 04:26 PM
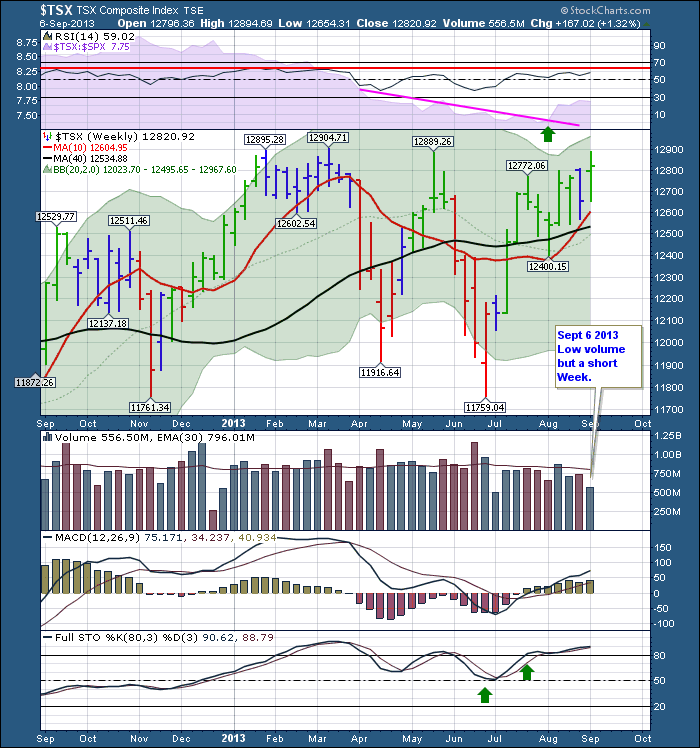
The $TSX has tried to move above the 12900 level a few times this year. We are approaching it again. Here is the live link to the $TSX Chart... Read More
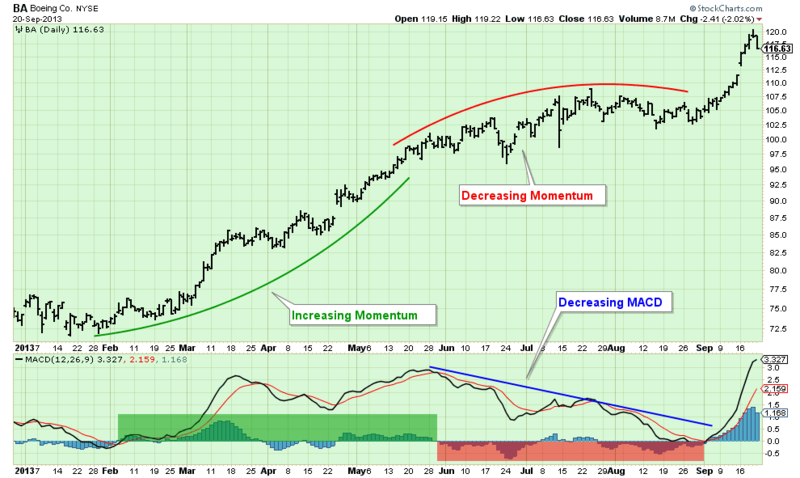
ChartWatchers September 07, 2013 at 04:21 PM
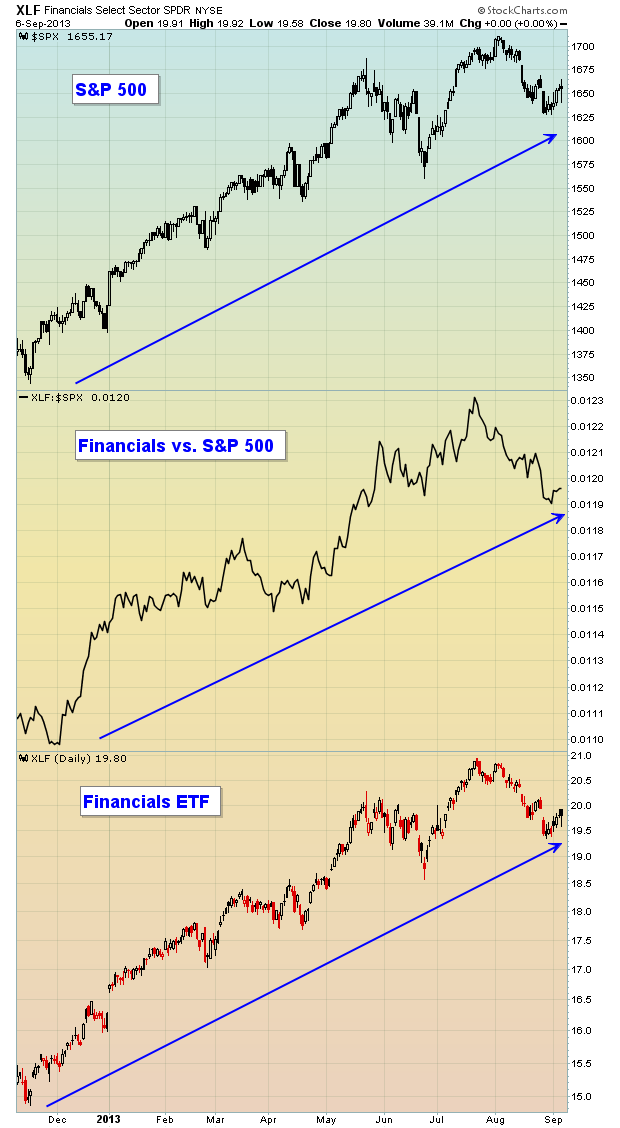
The past 5-6 weeks have not been overly kind to the bulls. In fact, since topping at 1709.67 at the close on August 2nd, the S&P 500 has lost more than 50 points or roughly 3%. Many are calling for the end of the four and a half year bull market...for the umpteenth time... Read More
ChartWatchers September 07, 2013 at 11:01 AM
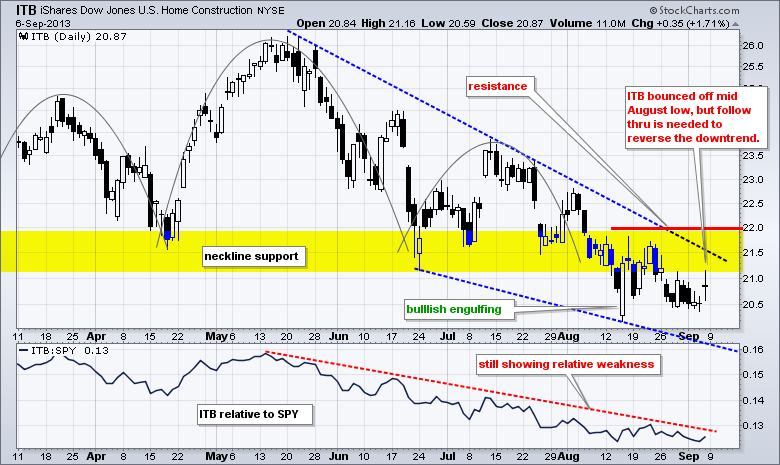
Treasury yields fell after Friday's jobs report and interest rate sensitive stocks got a bounce as utilities, REITs and homebuilders moved higher... Read More
ChartWatchers September 06, 2013 at 10:29 PM
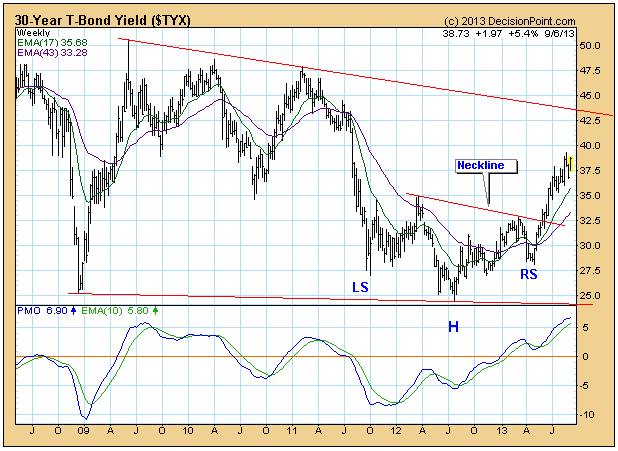
We have been observing how, in spite of the Fed's efforts, bond yields have been persistently rising, but now they have become very overbought... Read More
ChartWatchers September 06, 2013 at 09:35 PM
Hello Fellow ChartWatchers! Things are heating up in the markets now that we are past the Labor Day holiday and people are returning from their vacations. Currently the market averages appear to be driven largely by news (Syria, G20, etc... Read More