ChartWatchers August 18, 2013 at 04:33 PM
Hello Fellow ChartWatchers! Three consecutive down days at the end of the week confirmed that August is going to be a rough month for stocks. A couple of quick clicks on our Interactive PerfChart tool show that all of the major market averages moved lower this week by between 1... Read More
ChartWatchers August 17, 2013 at 08:17 PM
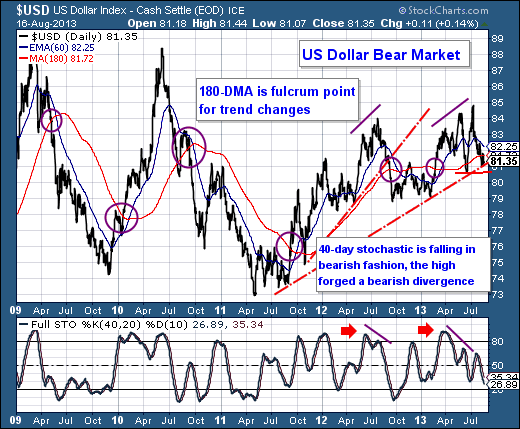
The capital market starting to trend once again. The 10-year note yield has risen rather swiftly in recent months, which has caused both the stock market and the US dollar to trade in a sideways movement... Read More
ChartWatchers August 17, 2013 at 08:13 PM
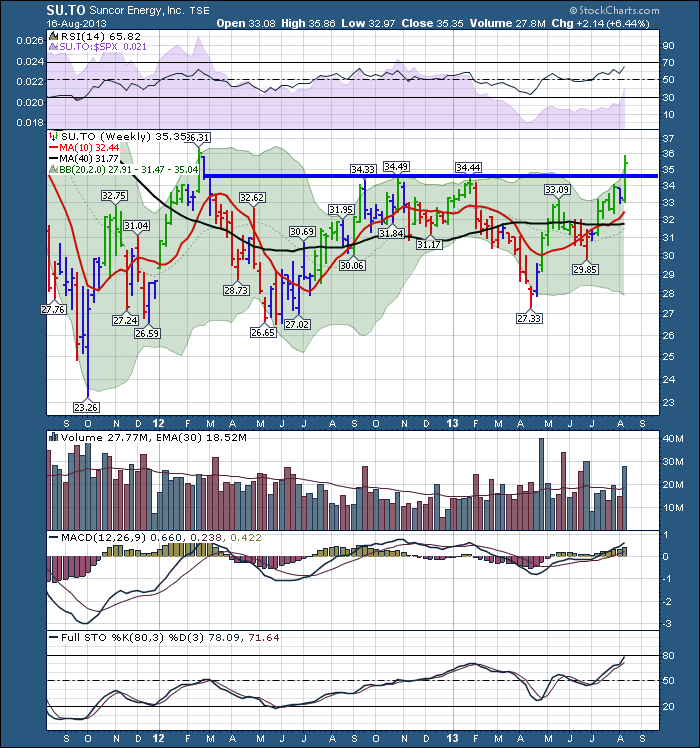
Canada had a popular TV show called The Friendly Giant. When Suncor merged with Petro Canada in March 2009 it become Canada's energy giant. It is the largest oil company on the $TSX by market cap and one of the top 5 companies in Canada as well. Here is the live link. Suncor... Read More
ChartWatchers August 17, 2013 at 08:09 PM
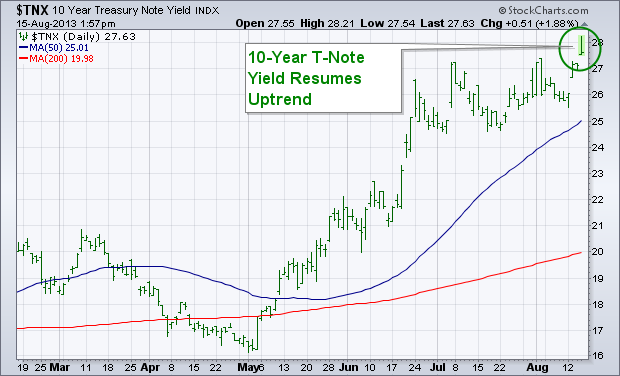
The uptrend that started in bond yields during May is resuming. Chart 1 shows the 10-Year Treasury Note Yield ($TNX) hitting a new recovery high today. That resumes the uptrend in bond yields... Read More
ChartWatchers August 17, 2013 at 06:24 AM
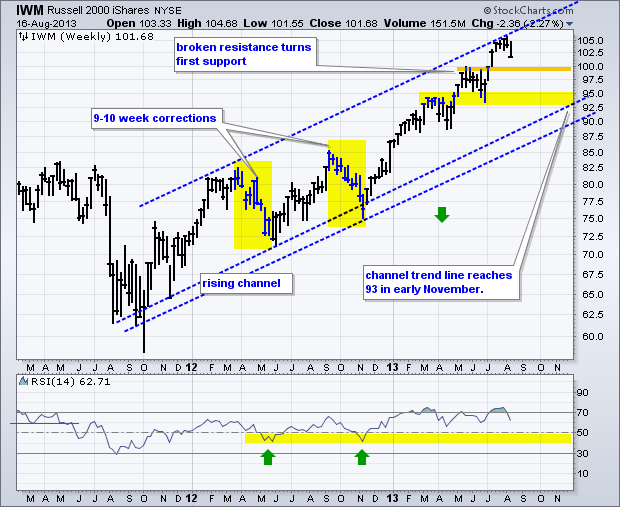
The Russell 2000 ETF (IWM) moved sharply lower this week to start a short-term downtrend, but this is still considered just correction within a bigger uptrend. There are simply no signs of a major top at this moment... Read More
ChartWatchers August 16, 2013 at 09:03 PM
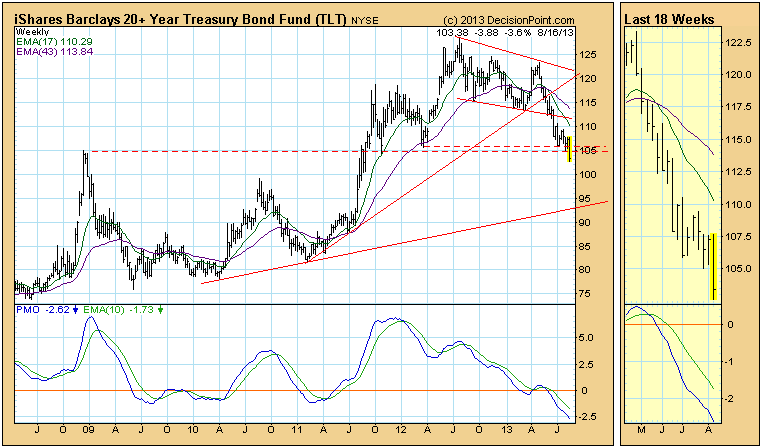
This week let's take a look at bonds because rising rates are capturing broad attention. We use the 20+ Year T-Bonds ETF (TLT) as the surrogate for long bond timing... Read More
ChartWatchers August 04, 2013 at 02:52 AM
Hello Fellow ChartWatchers! Today I am thrilled to announce a big change in how people can configure and use StockCharts to understand the markets and make better investing decisions... Read More
ChartWatchers August 04, 2013 at 02:25 AM
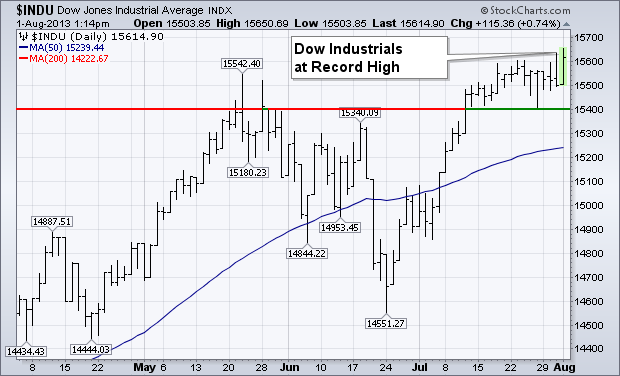
The Dow Industrials and Transports are hitting new record highs together once again. That's a sign of an ongoing bull market. [Dow Theory holds that an upside breakout in either one needs to be confirmed by a similar breakout in the other]... Read More
ChartWatchers August 04, 2013 at 02:21 AM
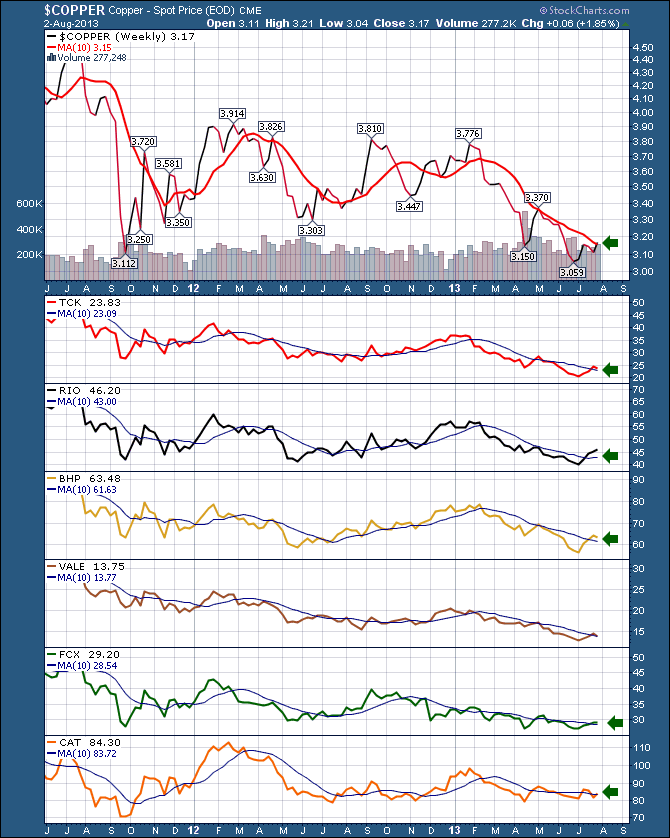
$COPPER is one of our best indicators of economic activity. It is usually early in bull markets and very weak when markets top. We all know that $COPPER has been under pressure for a long time. I like to use a dashboard of world mining leaders to confirm moves in $COPPER... Read More
ChartWatchers August 04, 2013 at 02:18 AM
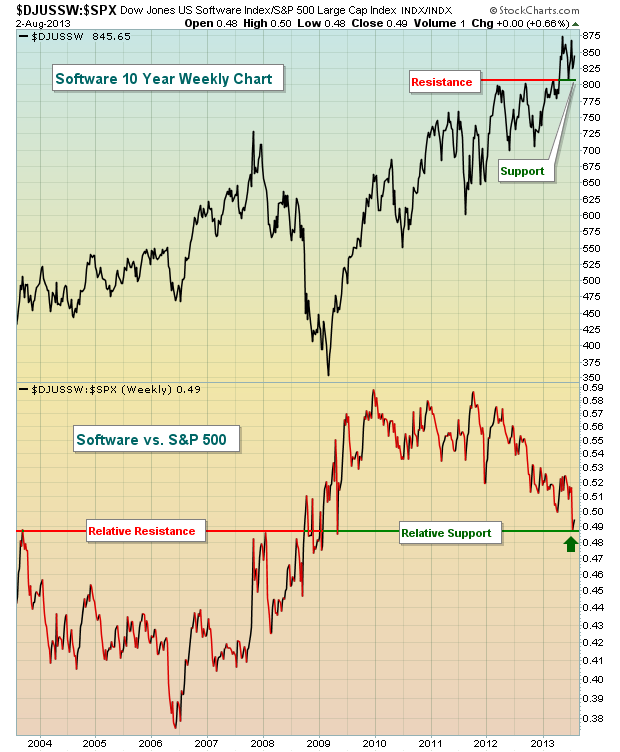
Most areas of the stock market have enjoyed the past few months, especially since the lows of June 24th. Don't count software as one of those groups, however... Read More
ChartWatchers August 03, 2013 at 04:30 PM
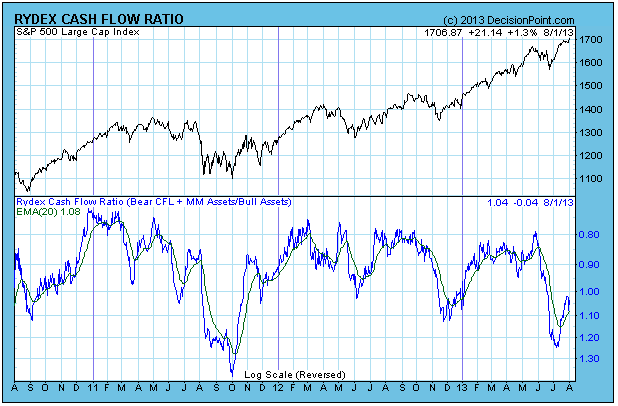
The Rydex Cash FLow Ratio is one of the sentiment indicators we track, and currently it is showing that investors are unusually reluctant to commit money to the current rally... Read More
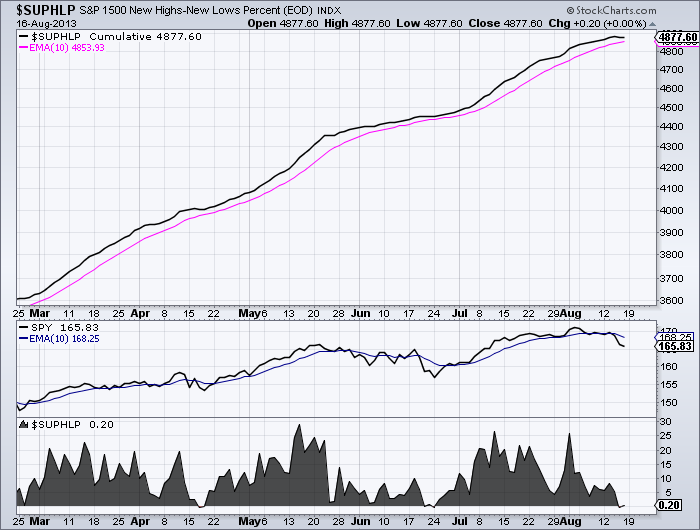
ChartWatchers August 03, 2013 at 07:00 AM
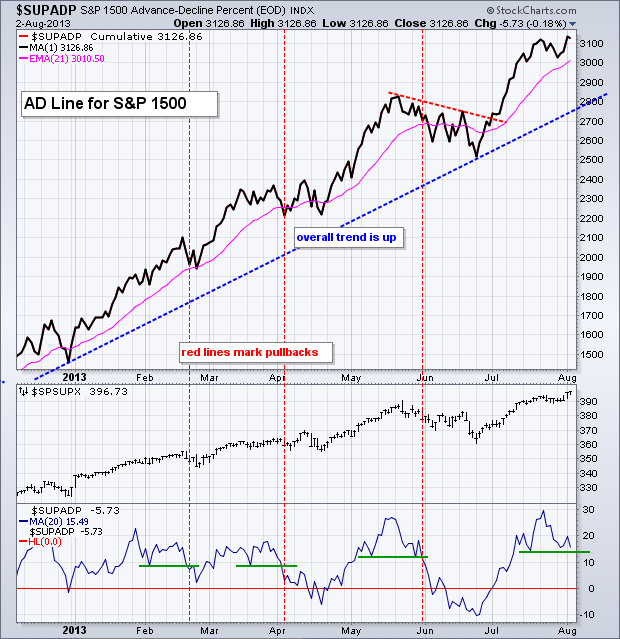
The major stock indices recorded 52-week highs this week and these highs were confirmed by the breadth indicators for the S&P 1500. Note that the S&P 500, S&P MidCap 400, S&P SmallCap 600, Nasdaq 100 and Dow Industrials recorded fresh 52-week highs this week... Read More