ChartWatchers September 20, 2015 at 12:08 AM
Hello Fellow ChartWatchers! The Fed's announcement on Thursday was the big news of the week both fundamentally and technically. Prior to the announcement, stocks had moved up nicely. After the announcement, those gains were all given back and then some. It was a pivotal moment... Read More
ChartWatchers September 19, 2015 at 12:48 PM
My September 2 message addressed the question about whether the market is in a normal correction or something more serious. We'll find out soon enough... Read More
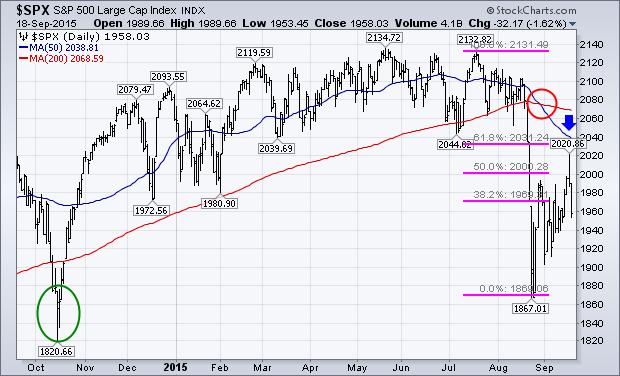
ChartWatchers September 19, 2015 at 12:43 PM
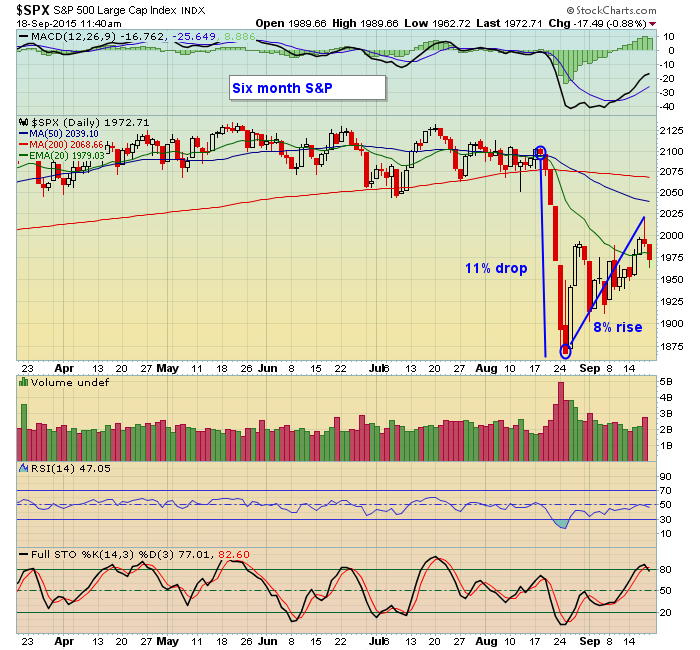
To say the past three weeks have been wild would be a major understatement. For example, the S&P lost 11% of its value in just 4 trading days ending in the most recent low of 1867 on August 24... Read More
ChartWatchers September 19, 2015 at 10:32 AM
When I wrote the title for the article, I started with "3 Reasons To Watch Commodities Now" and realized most people would add "Go Down, Go Down More, And Go Down A Lot More" on to the end. So I amended the title... Read More
ChartWatchers September 19, 2015 at 07:47 AM
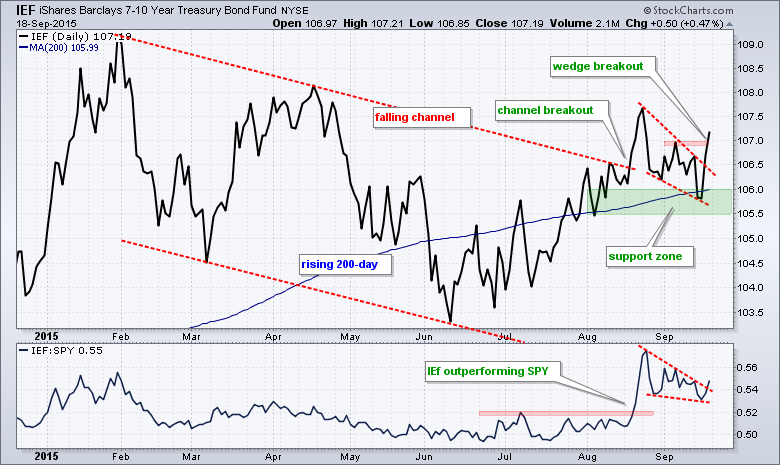
The S&P 500 SPDR (SPY) and the 7-10 YR T-Bond ETF (IEF) are going their separate ways as opposing wedges takes shape and IEF outperforms SPY (bonds outperform stocks). First, note that I am using close-only price charts to filter out some of the noise few weeks... Read More
ChartWatchers September 19, 2015 at 04:57 AM
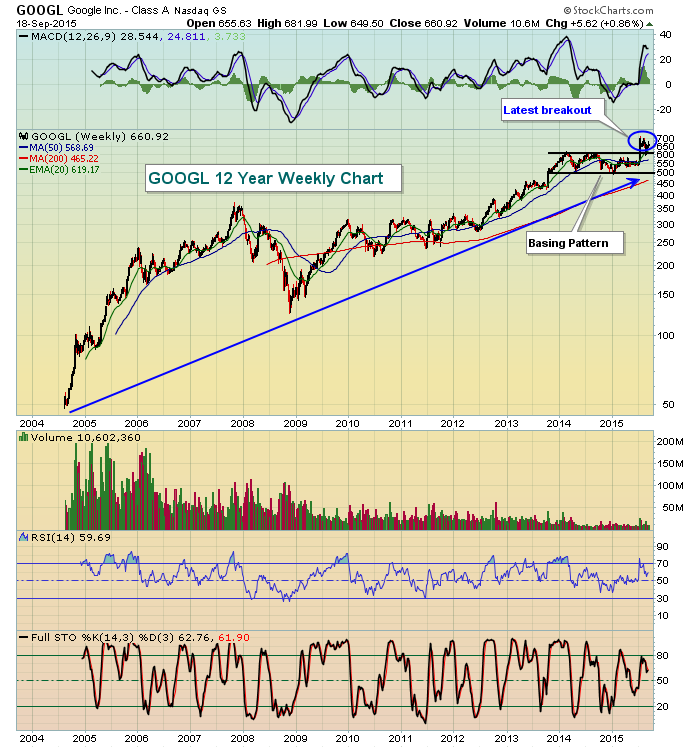
As we approach the end of the third quarter in 2015, it's time to unveil a few "Best Of" awards as they pertain to the NASDAQ 100. Let's get this party started: Best Buy & Hold Google (GOOGL). The long-term chart speaks for itself. You do have to deal with some volatility here... Read More
ChartWatchers September 18, 2015 at 07:37 PM
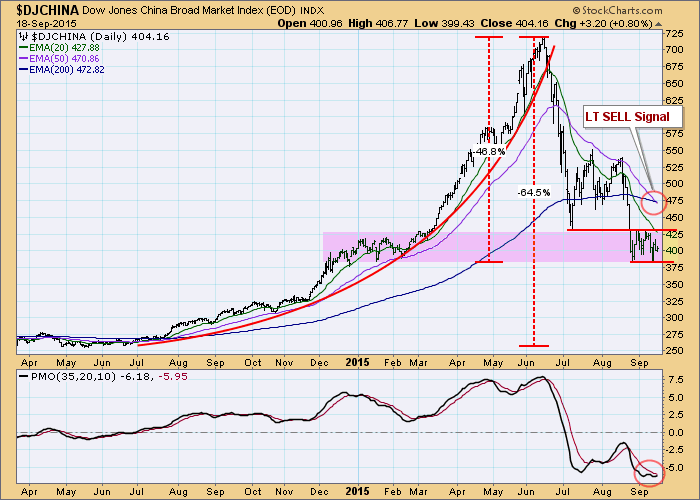
This week the DecisionPoint Long-Term Trend Model generated a long-term SELL signal for $DJCHINA, but it was a tad late, considering how far that index has fallen. This chart provides us with a good example of when mechanical signals need to be ignored... Read More
ChartWatchers September 07, 2015 at 07:09 PM
Hello Fellow ChartWatchers! We have lots to talk about since our last newsletter! For those of you who have been watching the "ChartWatchers LIVE" webinar, you know that for almost three months prior to the recent market collapse on August 19th, we had been expressing concerns ov... Read More
ChartWatchers September 06, 2015 at 12:18 PM
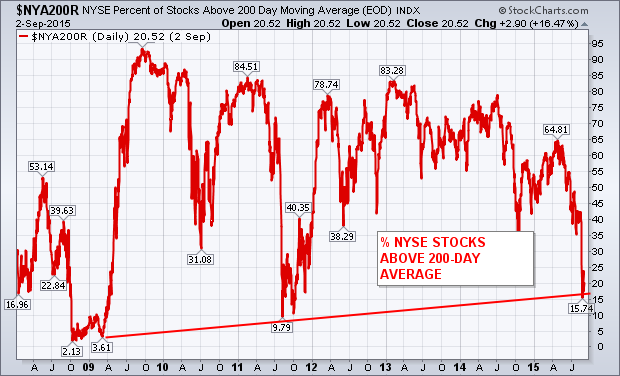
One of the warnings that I wrote about over the summer was the drop in the percent of NYSE stocks trading over their 200-day average... Read More
ChartWatchers September 05, 2015 at 11:50 AM
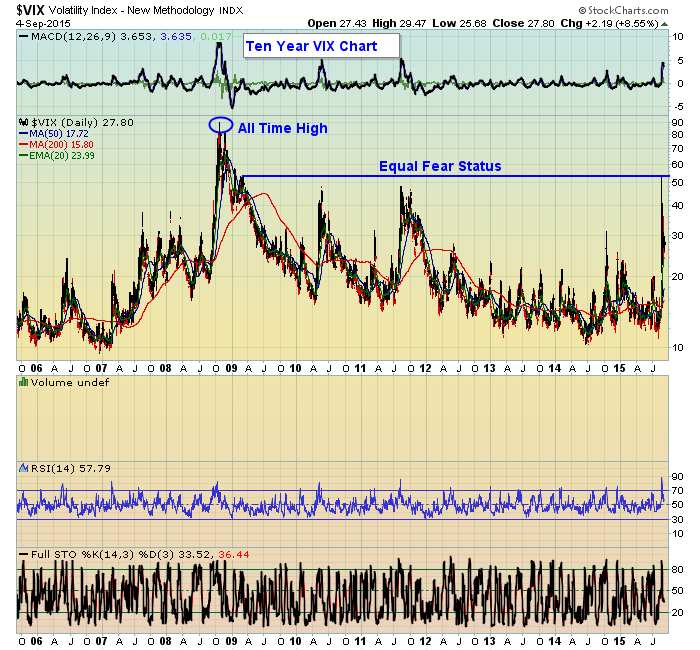
We've all heard that famous quote from Franklin D. Roosevelt in his first inaugural address. It's a saying that has had staying power for over 80 years. And it's something that rings true today in the current and volatile market environment... Read More
ChartWatchers September 05, 2015 at 11:17 AM
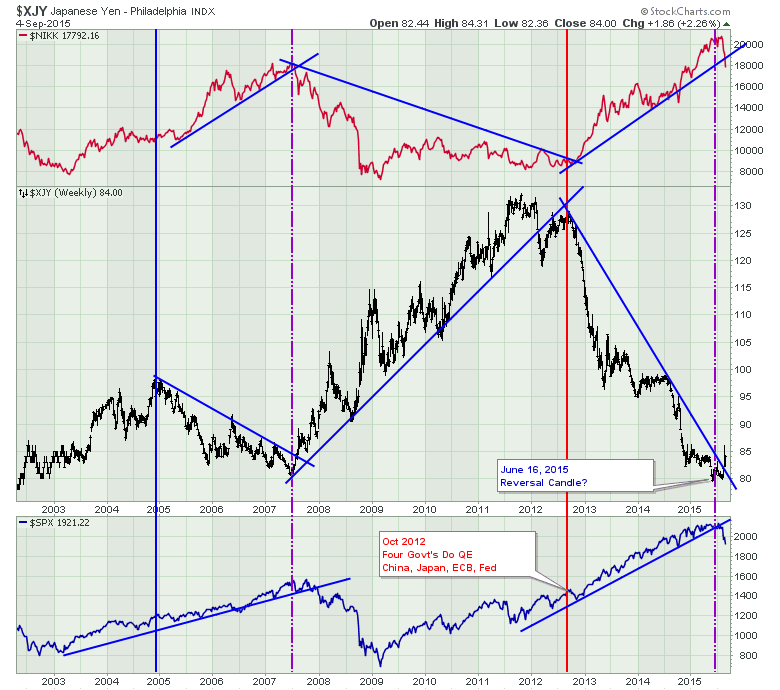
One of the areas I like to watch is the global arena. When the markets around the world are breaking down it can be a good warning signal for the US markets. Obviously, the big drop from the parabolic rise of the Shanghai market has been a concern globally... Read More
ChartWatchers September 05, 2015 at 10:34 AM
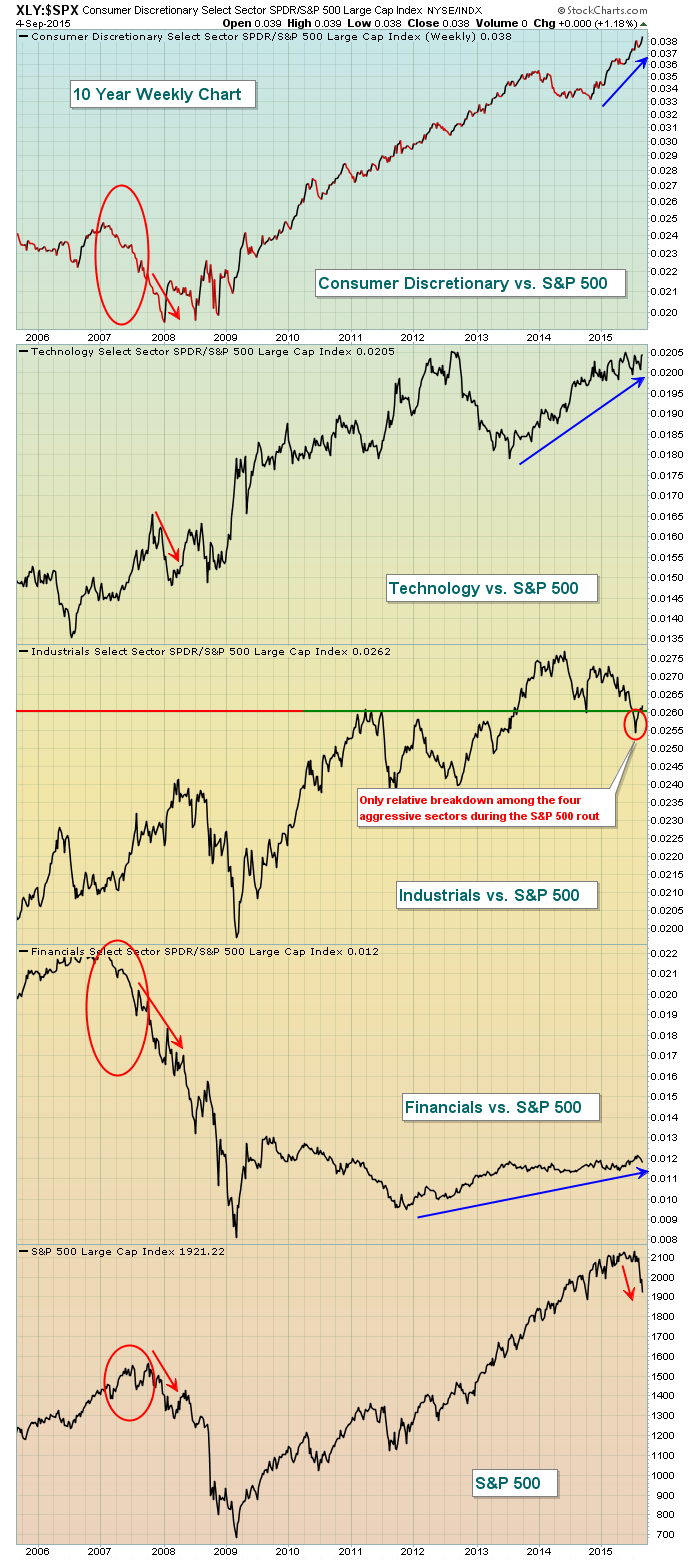
There are plenty of technical analysts calling for the beginning of a bear market after the past couple weeks of heavy volume selling. I'm certainly open to that possibility as I always respect price support breakdowns with accelerating volume... Read More
ChartWatchers September 05, 2015 at 04:35 AM
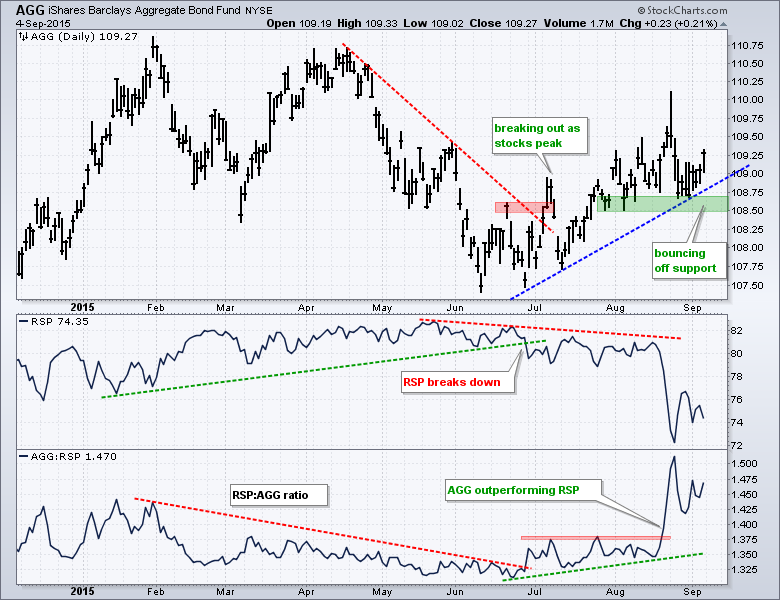
Bonds are outperforming stocks as money flows into relative safety and shuns risk. Overall, relative strength in bonds reflects risk aversion in the financial markets. Relative strength in bonds also indicates that investors should prefer bonds over stocks right now... Read More
ChartWatchers September 04, 2015 at 08:48 PM
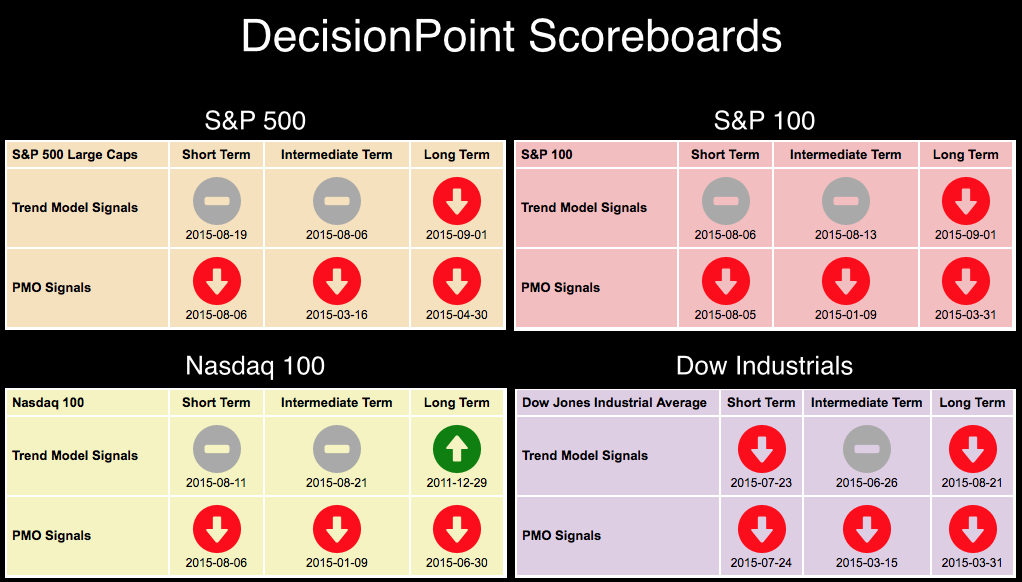
Take a look at the DecisionPoint Scoreboard for last week. (You'll find the Scoreboards in the DecisionPoint Chart Gallery. The link is on the homepage)... Read More