ChartWatchers October 18, 2015 at 07:35 PM
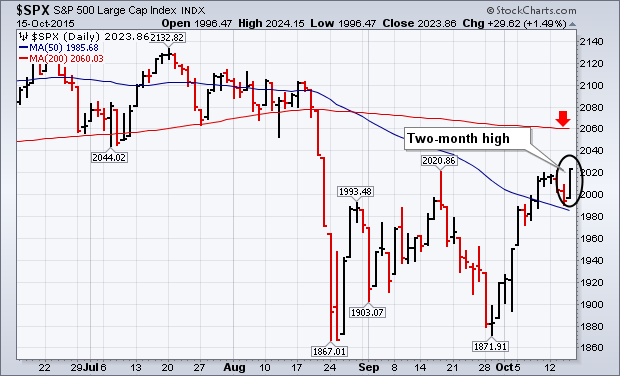
U.S. stocks continued the rally that started in late September. On Thursday, the Dow Industrials gained 217 points (1.2%) to extend its rally. The first chart below shows the S&P 500 gaining an even stronger 1.5%... Read More
ChartWatchers October 17, 2015 at 06:27 PM
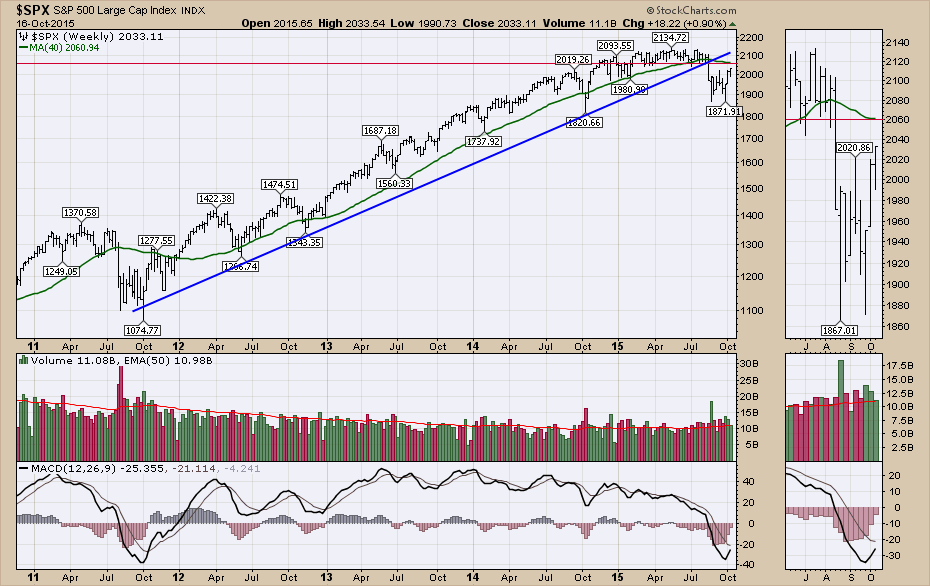
The Technical Analyst community is very mixed at this junction on the charts. Many of the senior professionals are suggesting a long-term bottom has been put in on October 1 and a race to higher highs is underway... Read More
ChartWatchers October 17, 2015 at 05:51 PM
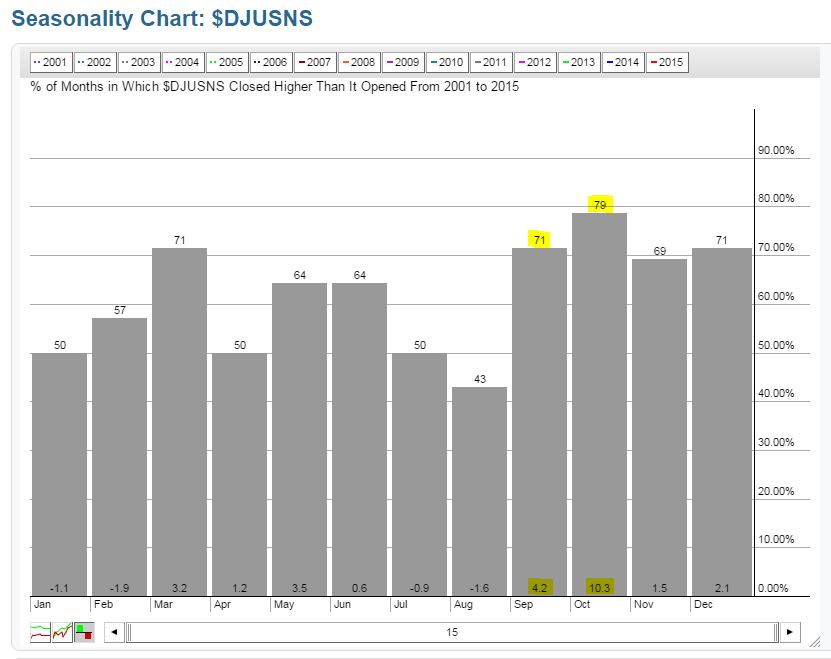
In prior months, I've used the seasonality tool here at StockCharts.com to identify industry groups poised to perform well... Read More
ChartWatchers October 17, 2015 at 05:11 PM
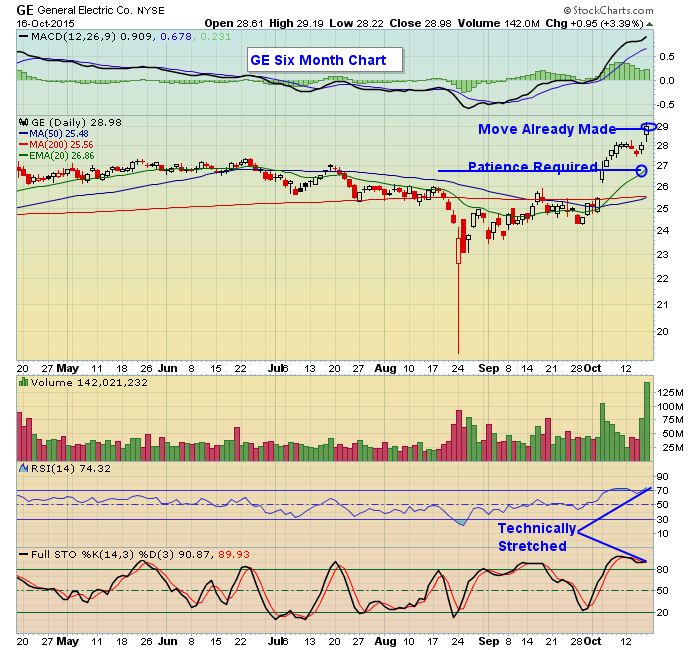
The earnings season is in high gear now with some very visible companies already reporting their numbers and thousands more about to report over the course of the next several weeks... Read More
ChartWatchers October 17, 2015 at 01:37 PM
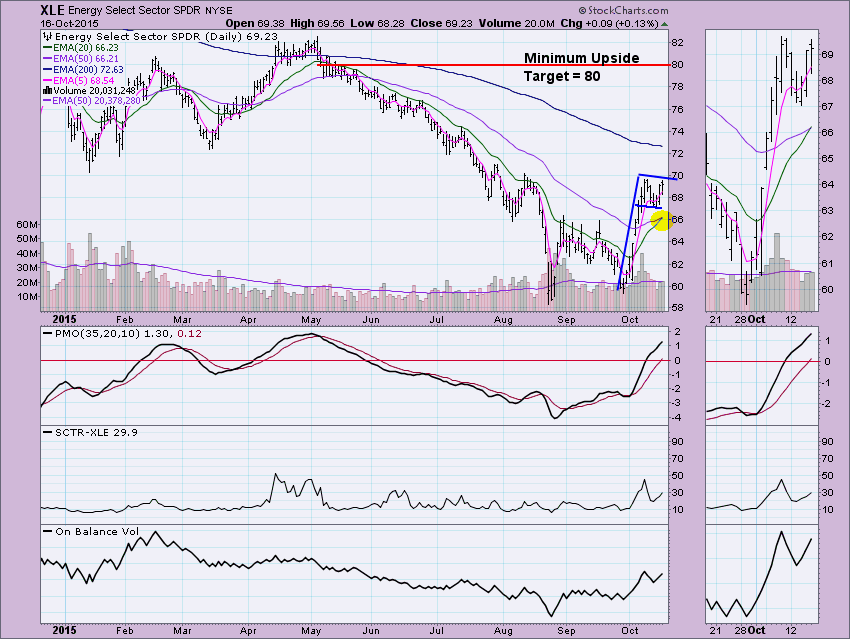
Energy and Utilities have both recently sparked my curiosity. It started with the Energy sector on our DecisionPoint Daily/Market Summary which flipped from Intermediate-Term Trend Model SELL signals to BUY signals... Read More
ChartWatchers October 17, 2015 at 06:58 AM
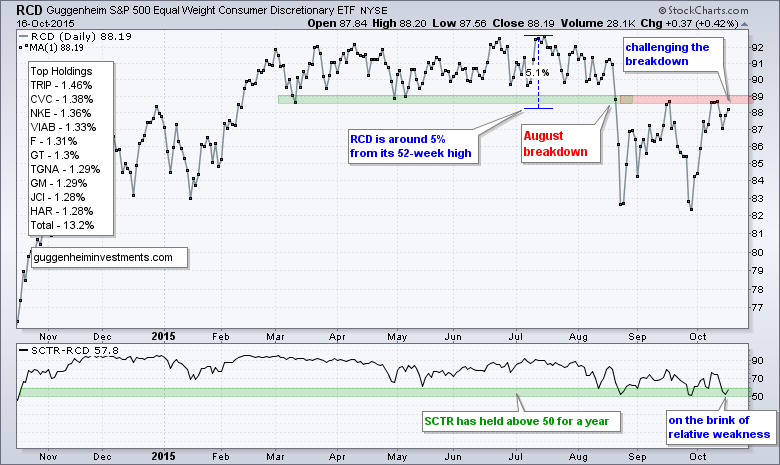
Large caps continue to outperform "other" caps and this has created a performance discrepancy within the consumer discretionary sector... Read More
ChartWatchers October 04, 2015 at 01:24 AM
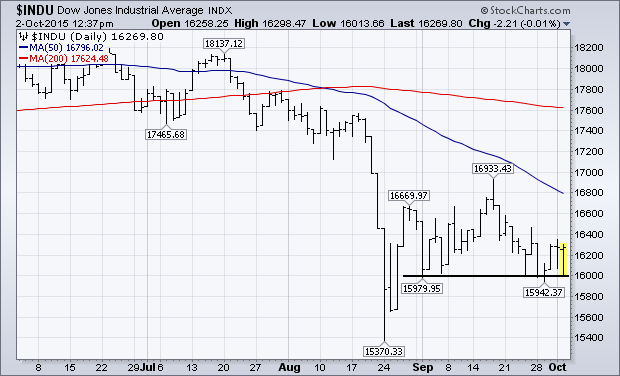
The stock market continues to test underlying support levels formed during the summer. The first chart (below) shows the Dow Industrials holding chart support along the 16,000 level... Read More
ChartWatchers October 04, 2015 at 01:08 AM
Hello Fellow ChartWatchers! Friday's market action is causing quite a buzz in the financial analysis world. After the "meh" US jobs report came out Friday morning, stocks gapped down sharply at the open but then rallied throughout the day and finished up roughly 1... Read More
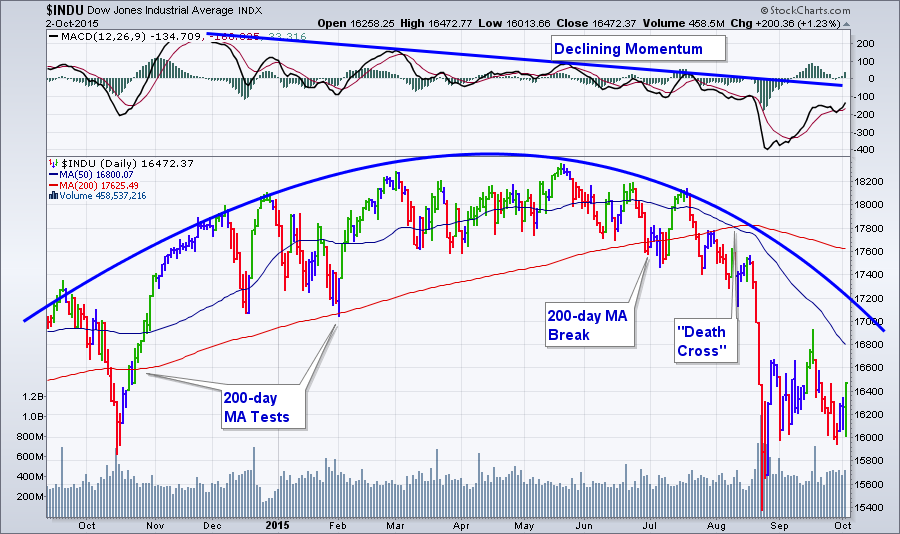
ChartWatchers October 03, 2015 at 06:32 PM
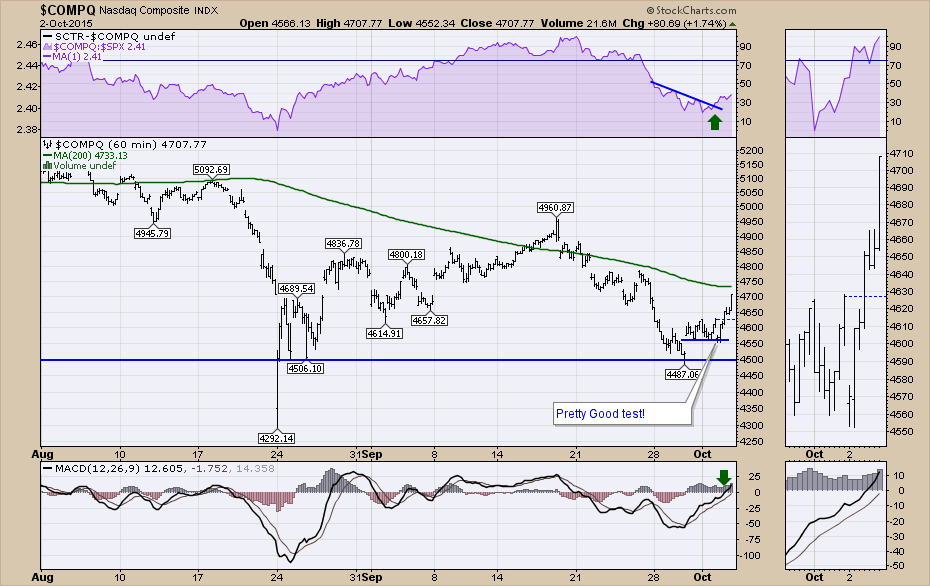
Friday was one of those hugely volatile days where the market plummeted on the bad news of the jobs data and then turned to soar for the upcoming earnings season. It was almost identical to the reversal in October 2011... Read More
ChartWatchers October 03, 2015 at 02:37 PM
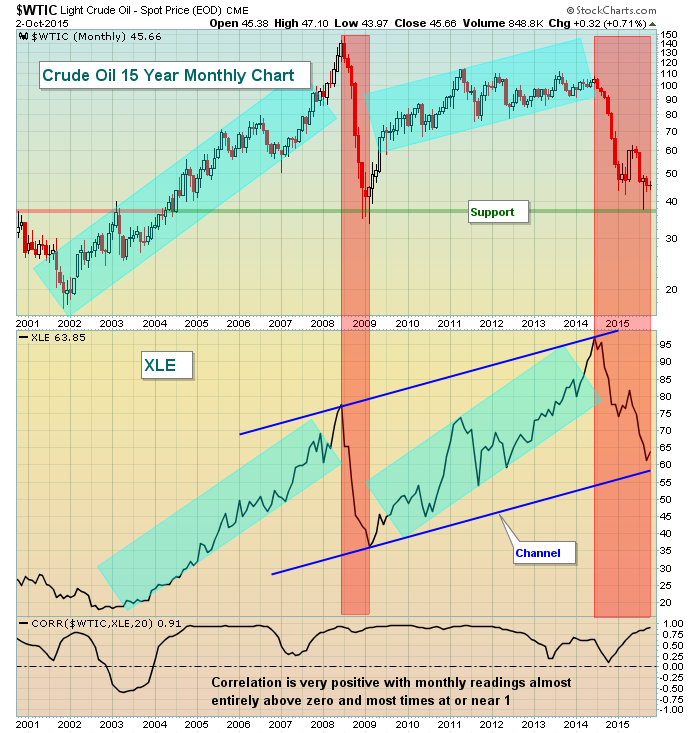
If you believe that crude oil ($WTIC) is dirt cheap and the primary trend from here will be higher, then one simple trading strategy is to own the XLE (Energy Select Sector SPDR). Over the years, the correlation between the two is strong - and perhaps obvious... Read More
ChartWatchers October 03, 2015 at 02:34 PM
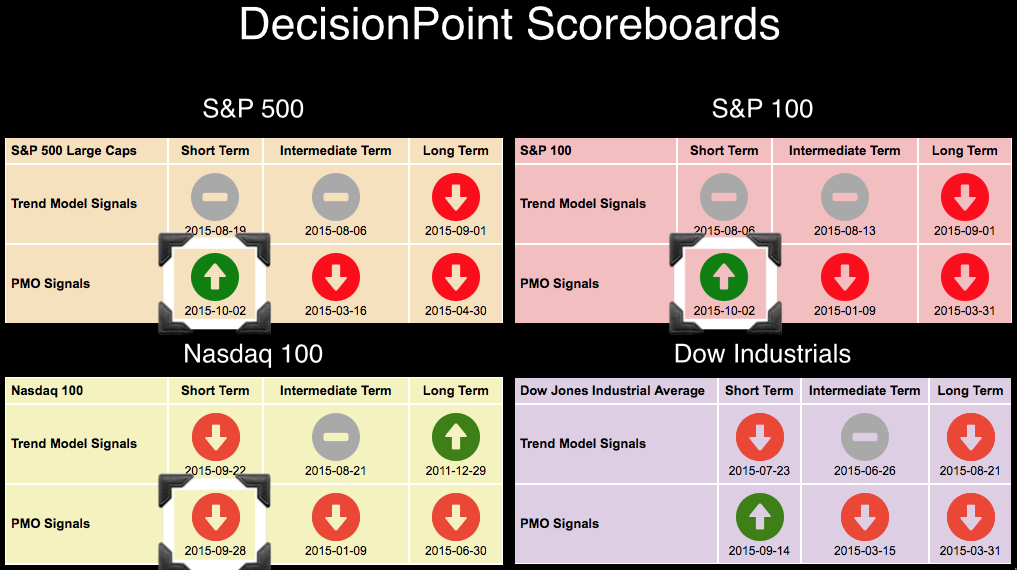
For many weeks, the DP Scoreboard for the Nasdaq 100 was the most positive in comparison to the S&P 500, S&P 100 and Dow Industrials. In fact, back when the NDX was in the lead with the most bullish signals, the others were grappling with more bearish signals... Read More
ChartWatchers October 03, 2015 at 01:38 PM
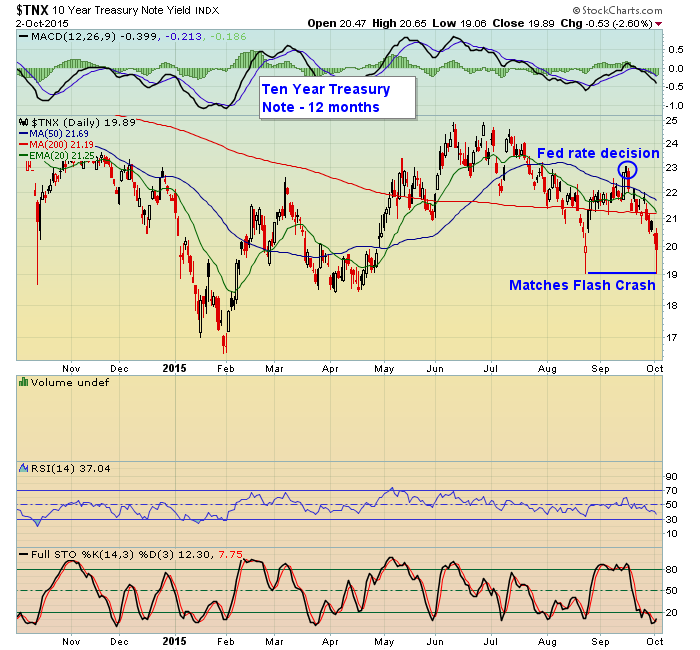
The much weaker than expected jobs report this past Friday put a kibosh on any intention the Fed might have had to raise interest rates during the month of October... Read More
ChartWatchers October 03, 2015 at 07:34 AM
The Oil & Gas Equip & Services SPDR (XES) perked up on Friday with a massive engulfing pattern on high volume. Combined with a bullish failure swing in RSI, the ETF could be setting up for a tradable low... Read More