ChartWatchers March 31, 2017 at 02:11 PM

The Stochastic Oscillator is best known as a momentum indicator, but a careful look at the formula reveals that it can also be used to measure trend strength... Read More
ChartWatchers March 18, 2017 at 04:34 PM
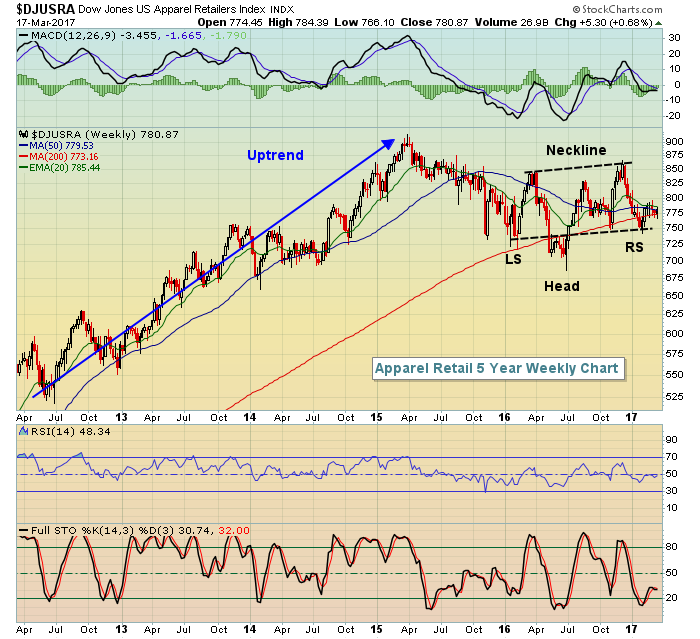
Over the past year, the Dow Jones U.S. Apparel Retailers Index ($DJUSRA) has been one of only four industry groups in the consumer discretionary space that has posted a loss. And over the past three months the DJUSRA is the worst performing area of consumer discretionary... Read More
ChartWatchers March 18, 2017 at 02:56 PM
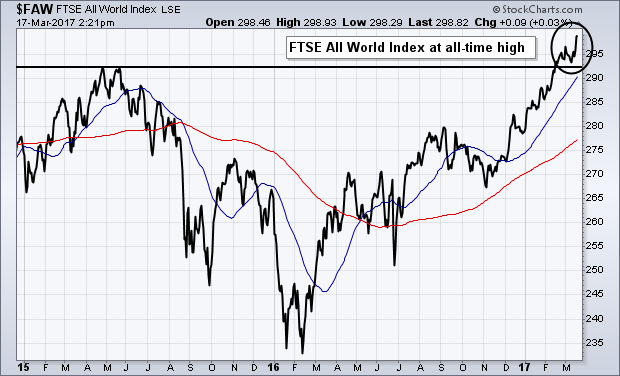
Chart 1 shows the FTSE All-World Stock Index ($FAW) trading at a new record high. The FAW includes stocks from 47 developed and emerging markets. It just recently cleared its 2015 high which resumed its major uptrend... Read More
ChartWatchers March 18, 2017 at 02:52 PM
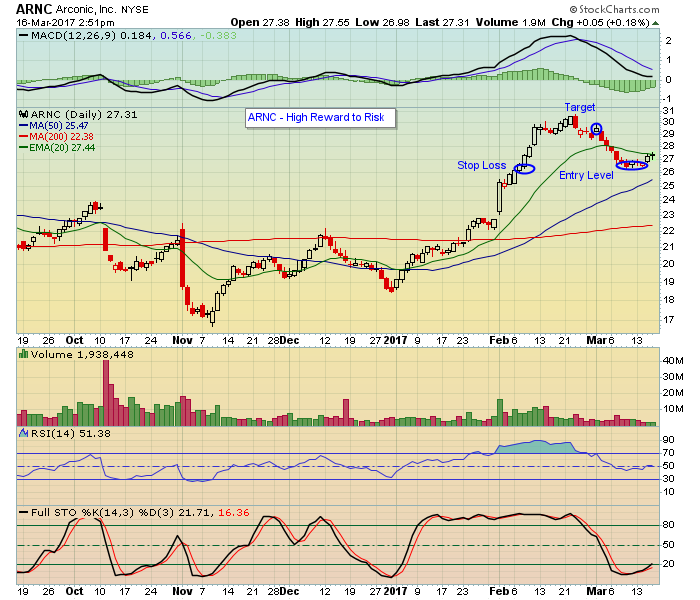
As part of our service at EarningsBeats.com we send trade alerts to our members on stocks that beat earnings expectations... Read More
ChartWatchers March 18, 2017 at 10:14 AM
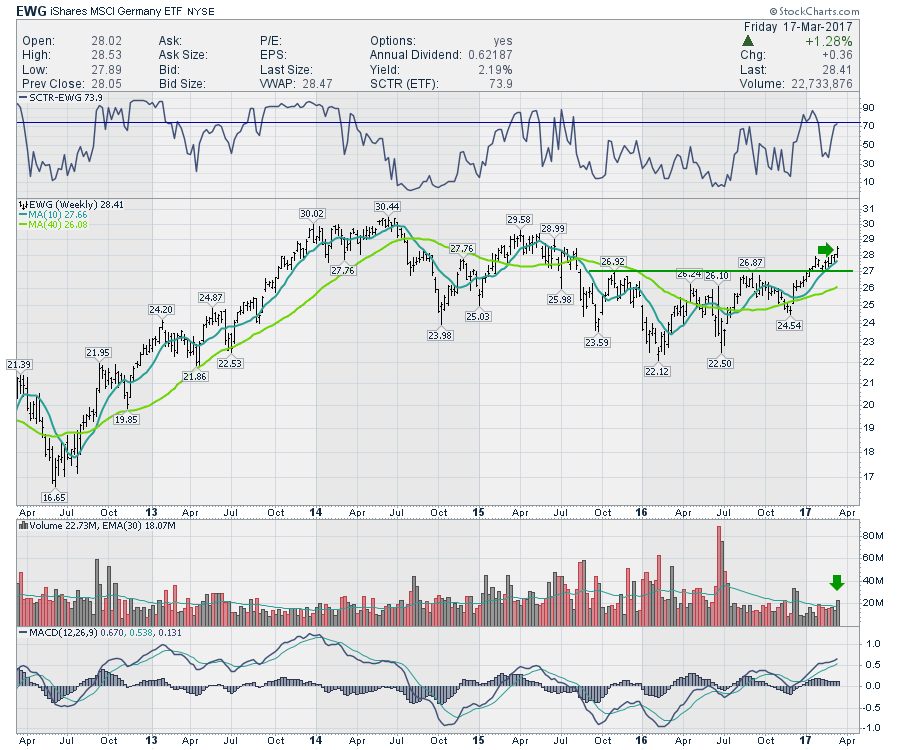
In my Chartwatchers article for March 4th, I was focused on some Country Indexes like Germany's $DAX and India's $BSE. The commentary revolved around watching these markets for potential breakouts. You can follow this link to check it out... Read More
ChartWatchers March 18, 2017 at 09:45 AM
Two Indicators in One Indicators generate lots of signals and many of these signals are just noise. It is imperative that chartists understand how their indicators work and exactly what these indicators are saying... Read More
ChartWatchers March 17, 2017 at 09:08 PM
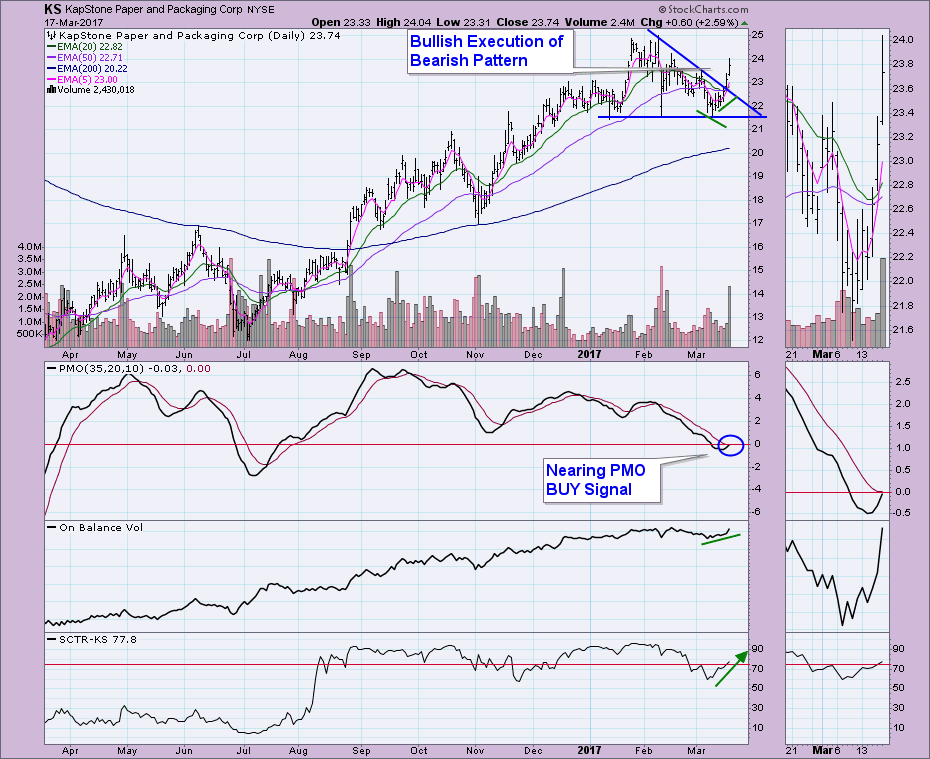
I am asked constantly about how to use the Price Momentum Oscillator (PMO) and Trend Models in a scan. These two ingredients combine into a great tandem for the scan engine. I'll give you a reprint of the scan and analyze a chart I found in it today... Read More
ChartWatchers March 04, 2017 at 12:48 PM
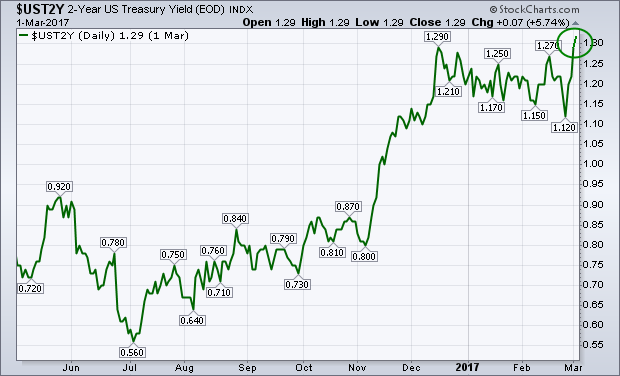
Chart 1 shows the 2-Year Treasury yield climbing above 1.30% on Thursday, for the first time in seven years. That shorter term yield is more sensitive to the potential for a rate hike than longer-range maturities... Read More
ChartWatchers March 04, 2017 at 11:24 AM
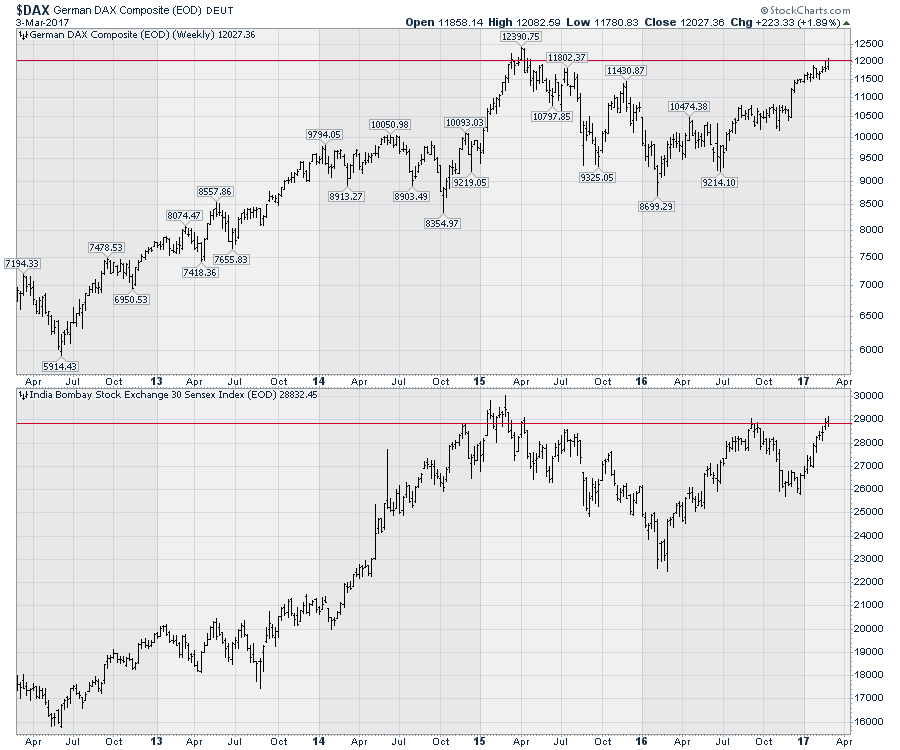
The USA has been a bit of an island in terms of the global markets. It continues to push above previous all-time-highs and usually leads global markets higher. This week is an interesting week as Germany, India, Canada, and Australia are all trying to break through to new highs... Read More
ChartWatchers March 04, 2017 at 10:03 AM
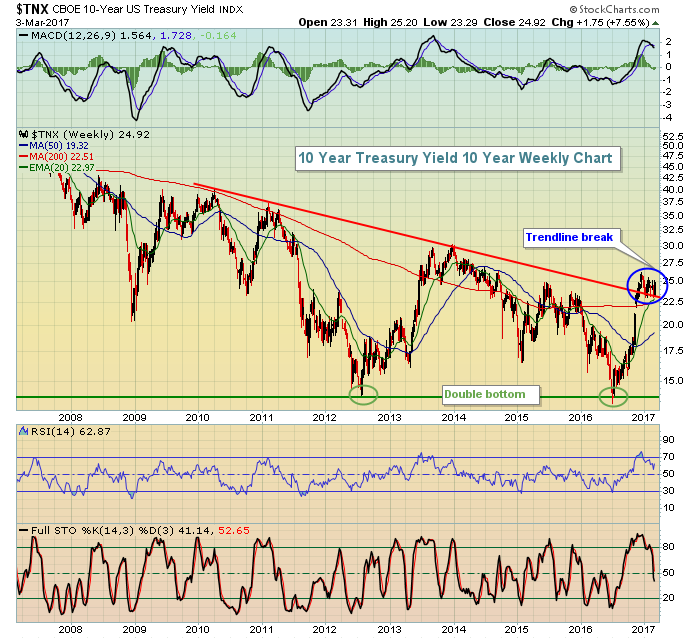
The FOMC will be meeting to discuss a potential rate hike in less than two weeks. A hike would continue the hawkish tone that began when the FOMC increased interest rates in December 2015 for the first time in nine years... Read More
ChartWatchers March 04, 2017 at 06:13 AM
The price relative tells us how a stock is performing relative to a market benchmark, such as the S&P 500. Even though this relative performance indicator is good for measuring relative momentum, it does not always tell the entire story... Read More
ChartWatchers March 03, 2017 at 08:40 PM
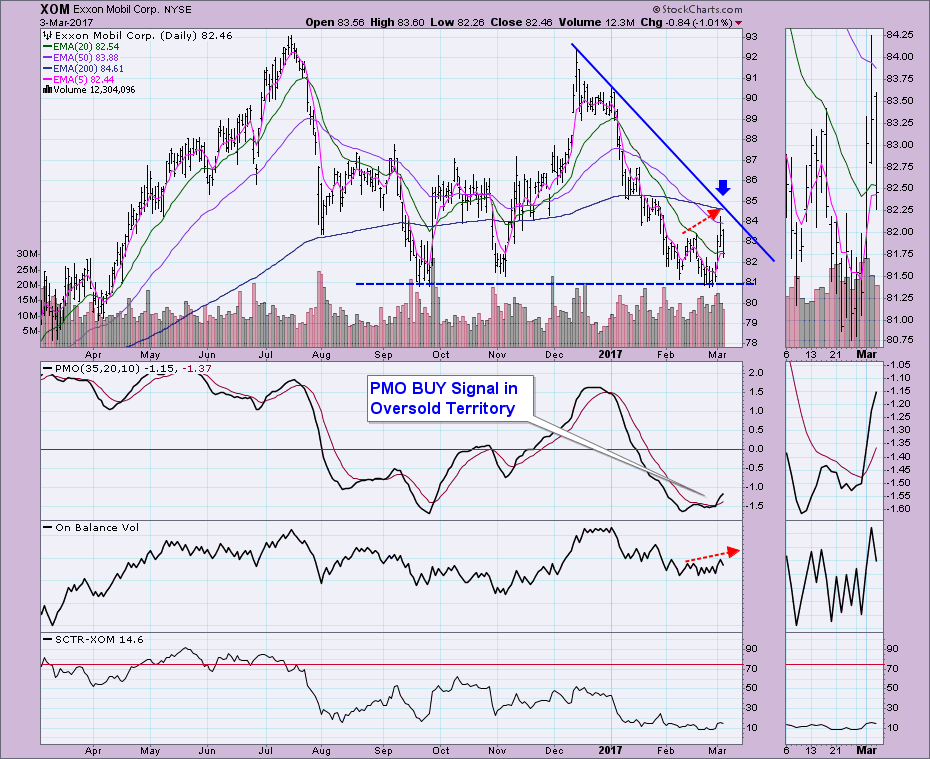
During the DecisionPoint Report webinars I've added a "chart spotlight". For those of you who were members of the original DecisionPoint website, you probably remember Carl's "Chart Spotlight" on Fridays... Read More
ChartWatchers March 03, 2017 at 06:48 PM
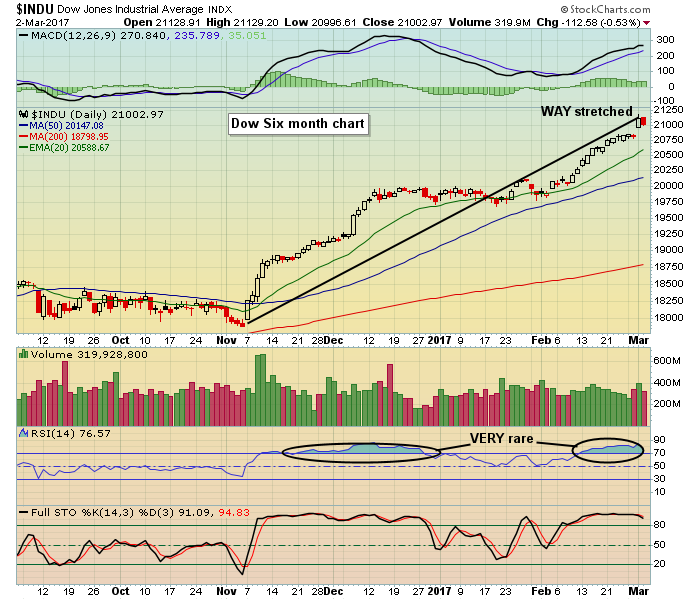
The rise in the major indexes since the election has been stunning. The S&P alone is up over 15% in just over 3 months. That would be a terrific year by any measure... Read More