
The 20+ YR T-Bond ETF (TLT) and Gold SPDR (GLD) are on a tear, but they are getting stretched by one key metric and could be ripe for a corrective period.
There are numerous ways to measure overbought (extended) conditions. Indicators like RSI (above 70) and the Stochastic Oscillator (above 80) have clear levels that mark overbought levels. Other indicators, like the Percentage Price Oscillator (PPO) require a little more guesswork, educated guesswork, of course. Wait a minute? The PPO is a moving average based momentum oscillator! How can we use it to measure overbought conditions? Let's see.
------------------------------------------------------------
This week in Art's Charts
State of the Stock Market - Meet Mr. Split - Index Breadth and Sector Breadth Model Updates, analysis for SPY and daily AD Percent, and the Bottom Line.
Technology Could Hold the Key Going Forward - Charting the leading ETFsgroups (bonds, defensives, gold and low volatility), as well as a list of the laggards.
Measuring Risk On/Off with Stocks, Treasuries, Junk Bonds, Low Volatility and High Beta - Junk bonds are seriously underperforming Treasuries and high beta stocks are underperforming low volatility stocks.
------------------------------------------------------------
The PPO measures the percentage difference between two exponential moving averages. Chartists can set the short EMA to 1 to measure how far the close is above/below the long EMA. A 1-period EMA is equal to the close. Thus, the weekly PPO(1,40,0) would measure the distance between the close and the 40-week EMA. Looking at a five year chart, we can then get an idea of what constitutes an overextended condition for the PPO(1,40,0). By the way, I set the last parameter, which is for the signal line, at zero to show the PPO as a histogram.
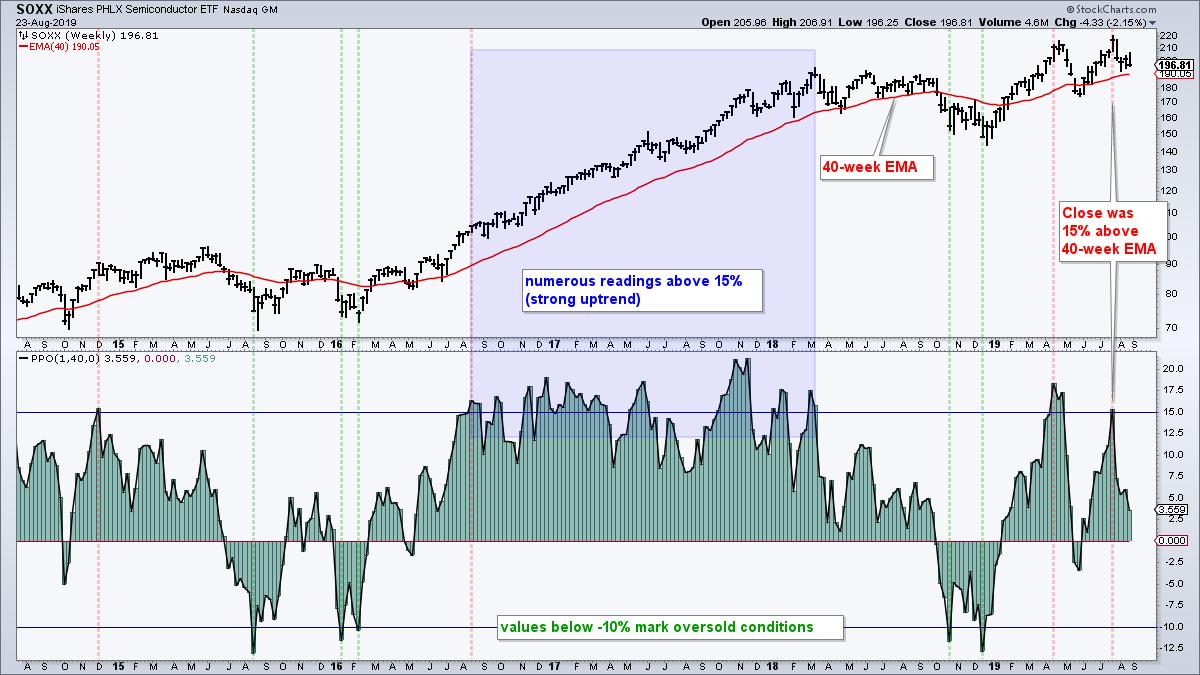
The chart above shows the Semiconductor iShares (SOXX) with the PPO(1,40,0). A reading above +15% seems to mark overbought conditions, while a move below -10% marks oversold conditions. However, notice how the ETF became "overbought" in August 2016 and the PPO then exceeded +15% numerous times until March 2018. Sometimes securities become overbought and remain overbought in strong uptrends, especially stocks in a bull market environment. The oversold levels (PPO < -10%), on the other hand, marked pretty good entry points over the last five years.
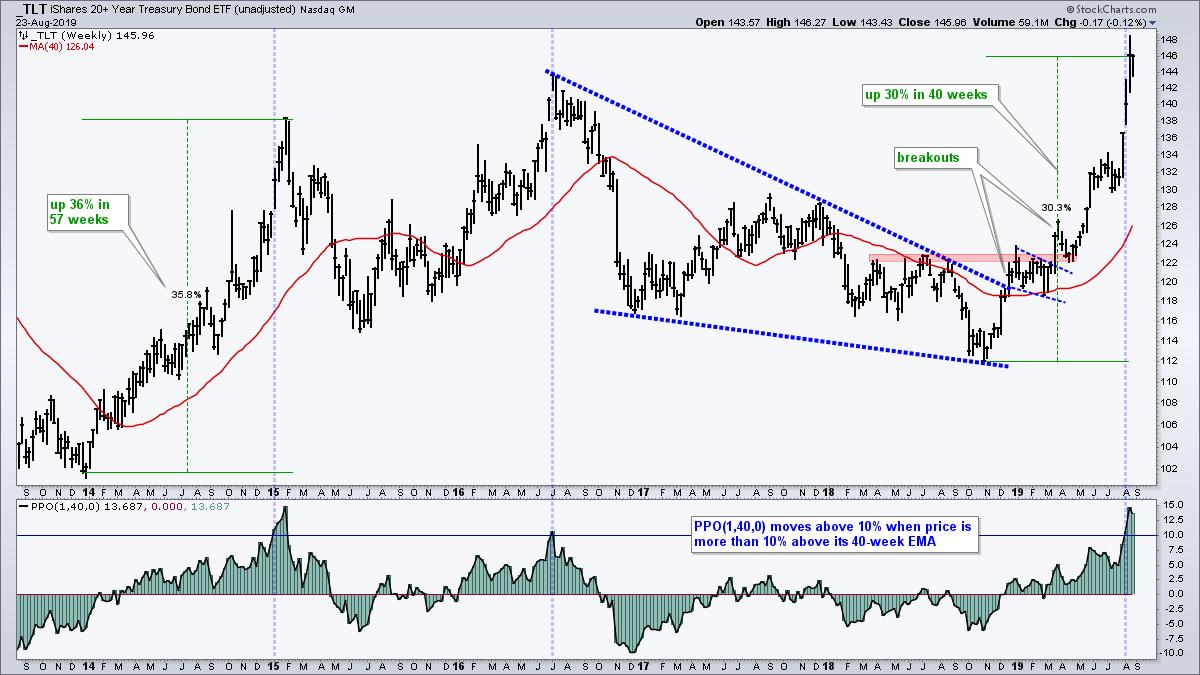
Now let's turn to bonds and gold. TLT surged over 30% from its late October low and hit a new high in August. It looks like blue skies, but TLT looks extended as the PPO(1,40,0) moved above +10% for the third time in five years (blue lines). While three instances are not enough to base a signal, it is not hard to figure out that TLT has come very far very fast, and a corrective period could take hold soon.
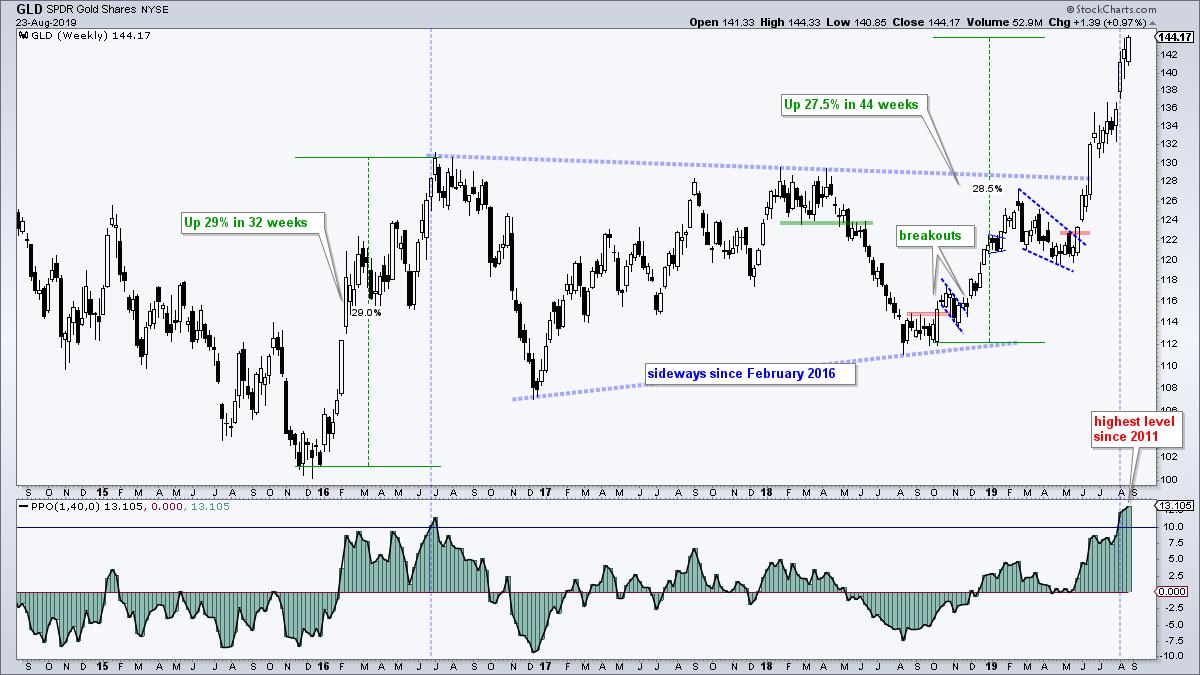
The next chart shows the Gold SPDR (GLD) with the PPO(1,40,0). GLD is up 28.5% since October and hit a string of new highs over the last two months. This is clearly a major breakout and the long-term trend is up, but GLD is quite extended with the PPO moving above 10% this month. As with TLT, GLD has come very far very fast and a corrective period could take hold sooner rather than later.
Keep in mind that overbought (and oversold) present up with a double-edged sword. On one hand, it takes strong upside momentum to become overbought. This is long-term bullish. On the other hand, securities that rise too far too fast are vulnerable to a corrective period, which could involve a pullback or a consolidation. A weekly overbought condition, such as I am seeing now in bonds and gold, puts these two in no man's land. Too strong to short, but too overbought to buy. Discretion is sometimes the better part of valor.
Choose a Strategy, Develop a Plan and Follow a Process
Arthur Hill, CMT
Chief Technical Strategist, TrendInvestorPro.com
Author, Define the Trend and Trade the Trend
Want to stay up to date with Arthur's latest market insights?
– Follow @ArthurHill on Twitter


