|
|
Last week, we released the first two of a series of "Theoretical" indexes that anyone can use to learn exactly how any technical indicator behaves "in the lab." These indexes are artificial in the sense that they are generated by us in a predictable manner. They all start with $TH because they are "theoretical" indexes.
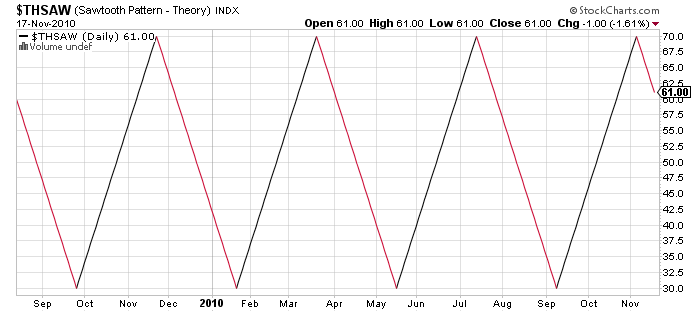
$THSAW moves at a 45 degree angle between 30 and 70. As soon as it reaches either of those values, it reverses immediately. It takes 80 days for it to complete an entire cycle. The name "SAW" comes from the fact that it resembles a sawtooth waveform from the world of audio synthesizers. Here's an example of $THSAW:

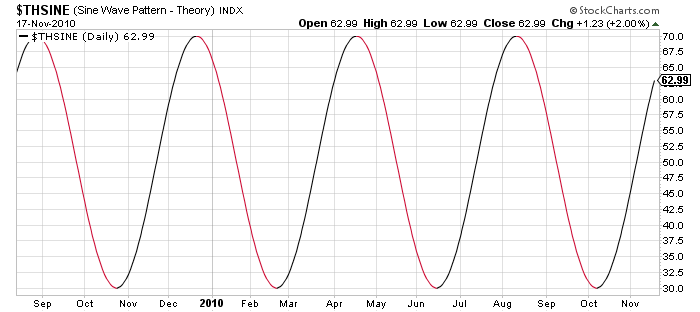
$THSINE is very similar to $THSAW except that is it based on a standard Sine Wave calculation which eliminates the instant change in direction that $THSAW has at 30 and 70. Here's an example of $THSINE:

We add data to both of these indexes every day so you will continue to see them "grow" over time.
Now, what in the world can we do with these things? Why would any care about artificial indexes like these?
These indexes allow you to see the behavior of various indexes under controlled conditions. Consider Wilder's DMI (ADX) indicator. It is used to help you determine if a stock is in an uptrend, in a downtrend, or moving sideways. By using that indicator on the $THSAW index, we can see exactly how it "should" behave - and that will allow us to use it more effectively in the "real world." Here are two examples of what I mean:
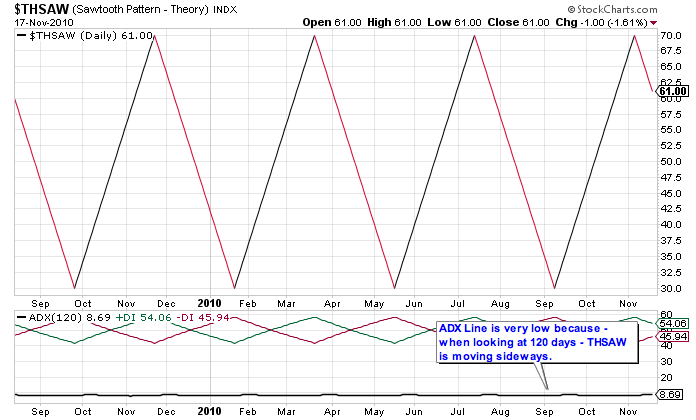
The period of $THSAW is 80 days. If you view $THSAW over a long period of time - more than 120 days - it appears that $THSAW is simply moving sideways in a flat channel. So what does the ADX line look like in that case? According to the definition of the ADX indicator, it should give a low reading because - in the long-term view - we are not trending up or down. Here's the chart:

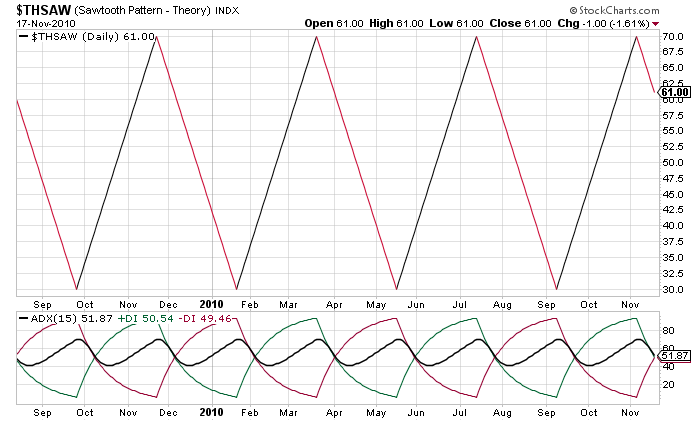
See how the 120 period ADX line is very low? That's exactly how it should be. But now, what would happen if we shortened the parameter for the indicator down to 15? Over the course of 15 days, $THSAW is almost always in a strong uptrend or downtrend. So in this case, we'd expect a very strong reading from ADX. Let's see:

And that is exactly what we get. (The ADX line goes down some every 40 days because when $THSAW changes direction the trend is not clear.)
Hopefully, from this example, you can see the usefulness of $THSAW for learning the "personality" of technical indicators - something all Chartists need to understand intimately. Please find some time and try using other indicators on $THSAW and $THSINE. What would the RSI do around those sawtooth "points"? What does ROC look like? Do those charts make sense?
If you are a true student of Technical Analysis, you'll be playing with these two indicators for quite some time. Enjoy!
- Chip
UPDATE: The Period of $THSAW and $THSINE was changed to 80 days after this article was originally published.


Posted by: Gord Greer November 15, 2010 at 11:34 AM
Posted by: Daniel Ram November 16, 2010 at 03:39 AM