|
|
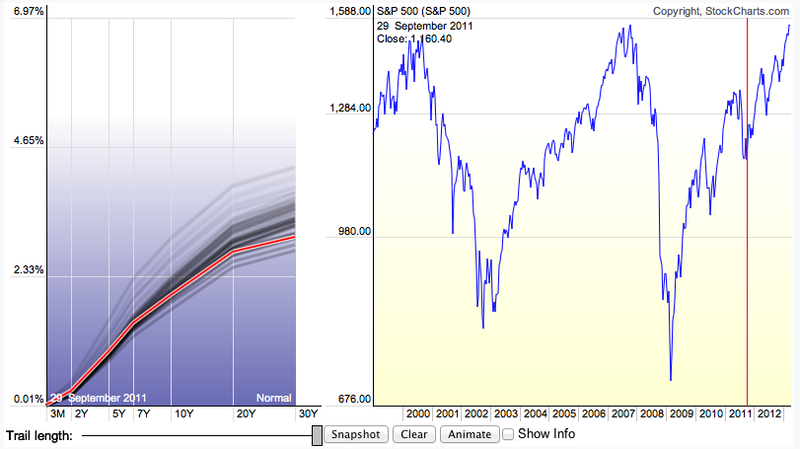
Earlier this year we converted our Interactive PerfCharts tool from Java to HTML5. This month, we've done the same for our Dynamic Yield Curve. As I mentioned before, Java continues to be a problematice solution for client-side interactivity. It has always been a struggle to support Java because some of our customers have had a very hard time installing and upgrading it successfully. The large number of recent securuty issues was the final straw that forced us to start migrating our Java-based tools to the new kid on the block, HTML5.
The pros of HTML5 are many - built-in to the browser, loads faster, not owned by one company, very flexible, etc. The downside of HTML5 - lack of support in older browsers - continues to fade. Still, if you are using IE 7 or IE 8, you'll need to upgrade.
Once you do, you can click on the Dynamic Yield Curve link on our homepage to see the new version. If you've never played with this tool, it's worth taking some time to look at. The Yeild Curve is a great indicator of future trouble in the stock market and this tool shows you how that has worked in the past as well as what the current curve looks like.
We'll continue to migrate our interactive tools away from client-side Java in the coming months. As always, stay tuned...
- Chip


