DecisionPoint July 31, 2016 at 12:01 PM
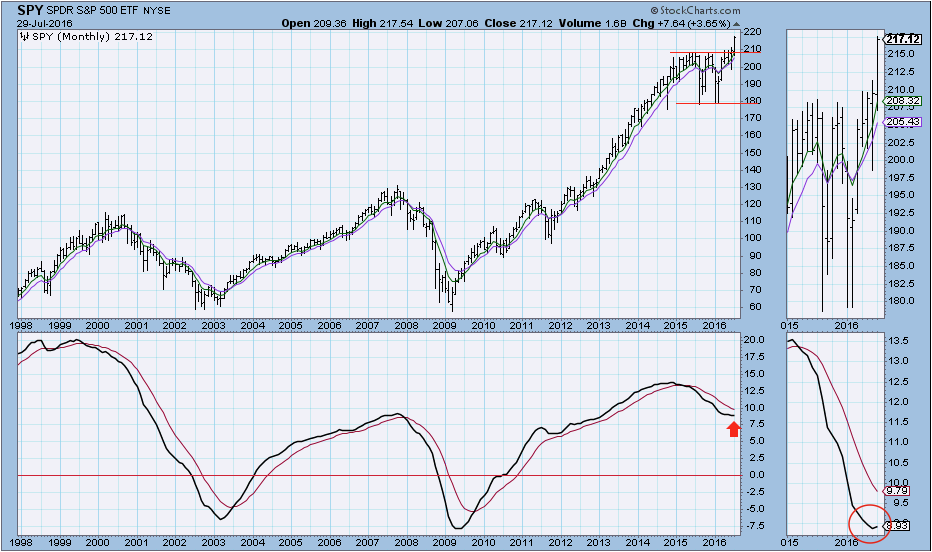
I tend to give monthly PMO direction changes heavier weight in my analysis because they often foreshadow long-term changes in the price trend... Read More
DecisionPoint July 28, 2016 at 06:55 PM

One look at the DecisionPoint Scoreboards and a review of the DP Market/Sector Summary and you'll see the plethora of BUY signals and green paint. Yet the market is traveling sideways and has been for 12 days. Should we expect an upside break or downside break? Read on... Read More
DecisionPoint July 26, 2016 at 09:16 PM

The Nasdaq 100 has been running toward its all-time highs while the S&P 500 already surpassed its all-time high a few weeks ago. The SPX has been consolidating sideways and rounding ever since the breakout; whereas, the NDX continued to stretch upward... Read More
DecisionPoint July 24, 2016 at 01:29 PM
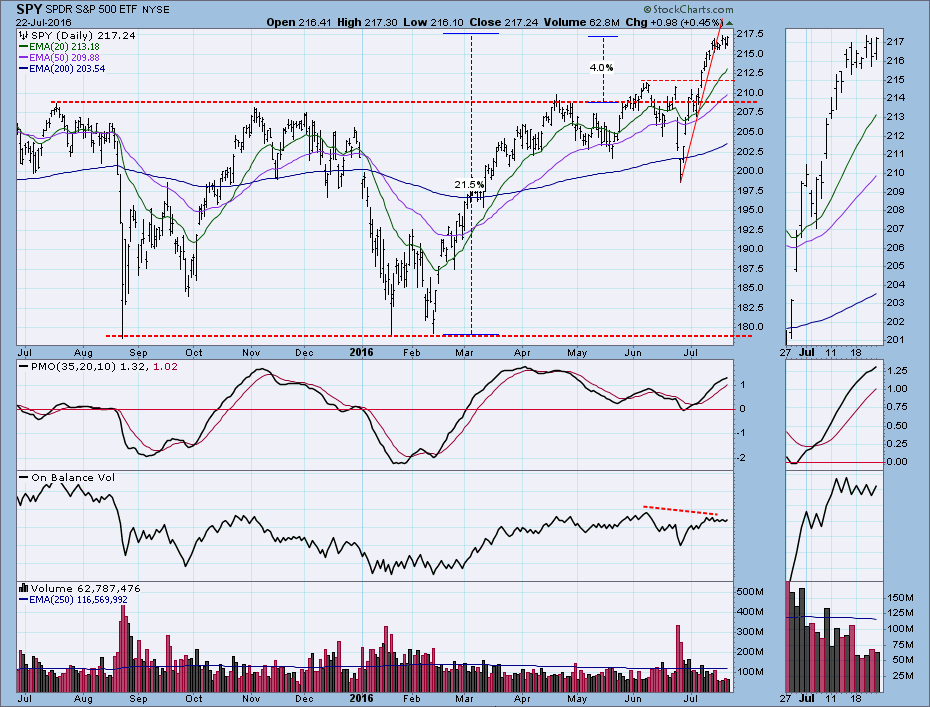
The stock market (SPY) has: (1) advanced over +20% from its February low, (2) after breakout, advanced +4% above the top its one-year continuation pattern (consolidation), and (3) generated a DecisionPoint IT Trend Model BUY signal on March 7, 2016... Read More
DecisionPoint July 21, 2016 at 06:33 PM

DecisionPoint timing models are tracked by Timer Digest, a professional journal for technical analysis timing... Read More
DecisionPoint July 16, 2016 at 11:28 PM
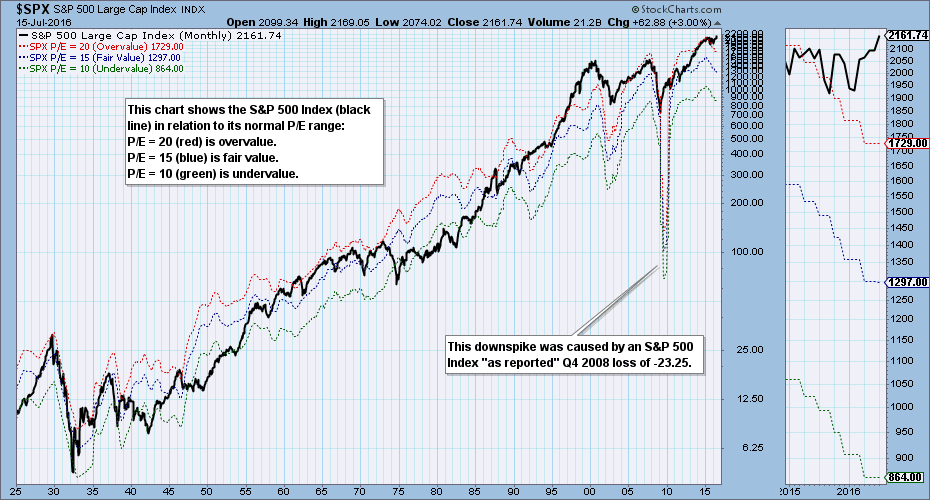
The S&P 500 Index 2016 first quarter earnings results are in, and it is time once again to take our quarterly look at our earnings chart, which shows the S&P 500 in relation to its normal value range. (Note: The chart is a static graphic, not an active chart... Read More
DecisionPoint July 10, 2016 at 11:32 AM
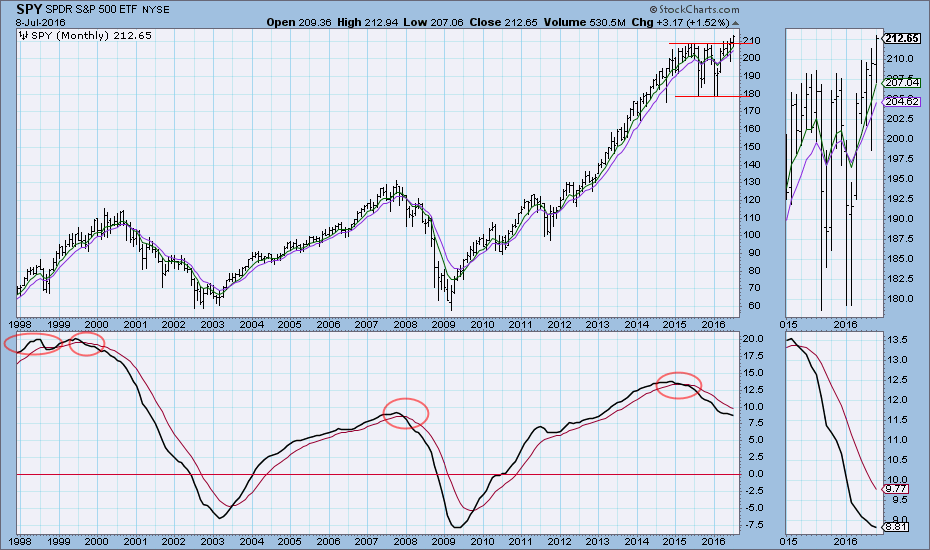
Since the monthly PMO topped in December 2014, then crossed down through its signal line in early 2015, I have been looking for a bear market to begin... Read More
DecisionPoint July 07, 2016 at 07:13 PM

The Price Momentum Oscillator (PMO) is mostly bounded oscillator. The PMO can be calculated for any stock, index, ETF, etc. Interestingly, each of them have their own "normal" ranges... Read More
DecisionPoint July 03, 2016 at 04:55 PM
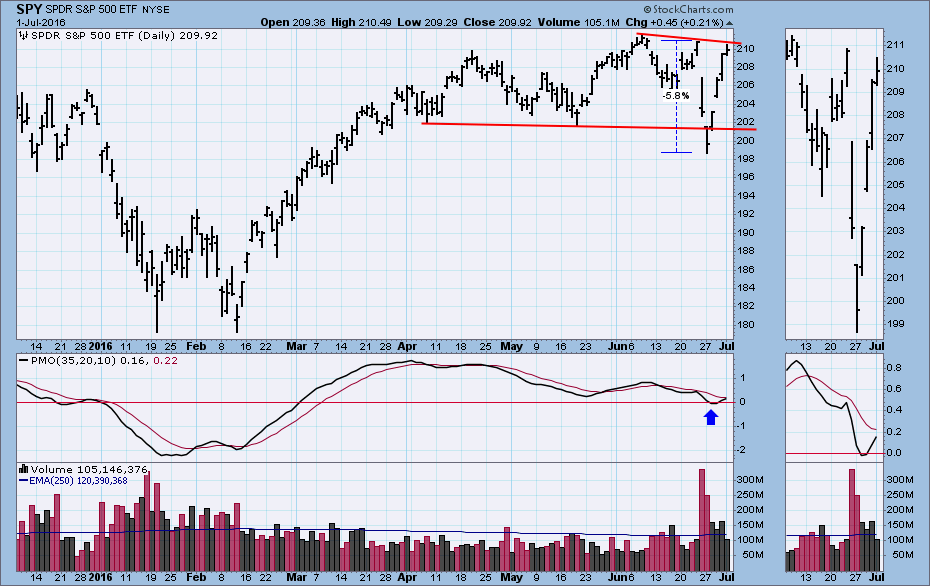
On the Friday ahead of the Brexit vote I made an assessment of the market condition and speculated as to what affect it might have on market action the next week. My conclusion was that the technicals were negative and would tend to weigh on the market regardless of direction... Read More