Don't Ignore This Chart! February 28, 2014 at 04:35 PM
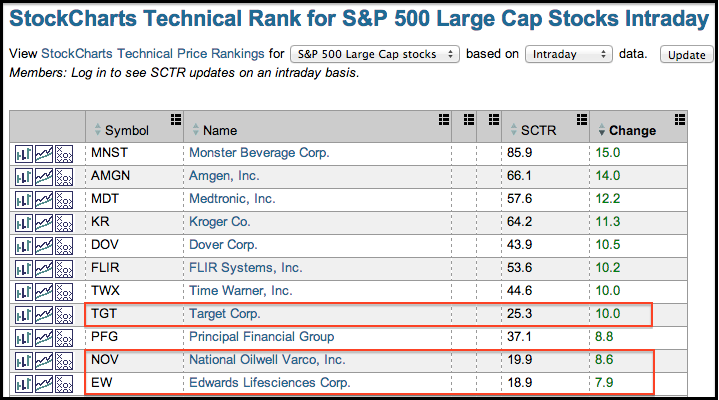
The first image shows a screen shot from the StockCharts Technical Rank (SCTR) sorted by change to highlight the biggest movers. Three of these show big moves from relatively low levels (TGT,EW,NOV). Big moves mean something is happening and we should check the charts... Read More
Don't Ignore This Chart! February 27, 2014 at 01:53 PM
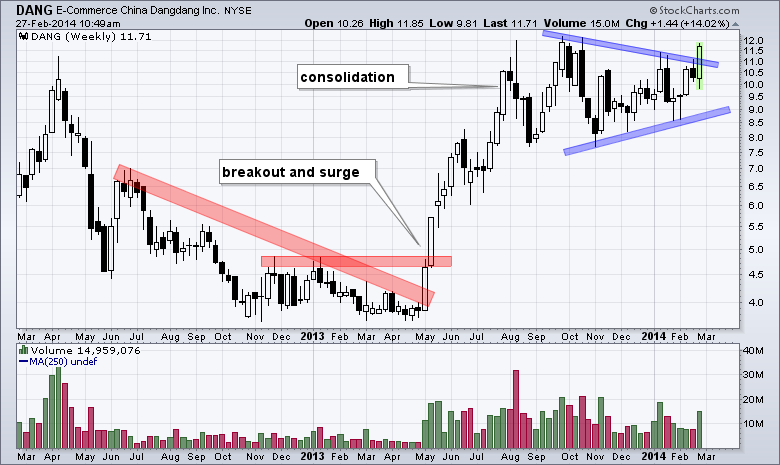
Shares of Dangdang ($DANG) are making a big move this month with a triangle breakout on expanding volume. First, notice how the stock surged from ~4 to ~12. Second, the triangle consolidation worked off overbought conditions... Read More
Don't Ignore This Chart! February 26, 2014 at 04:12 AM
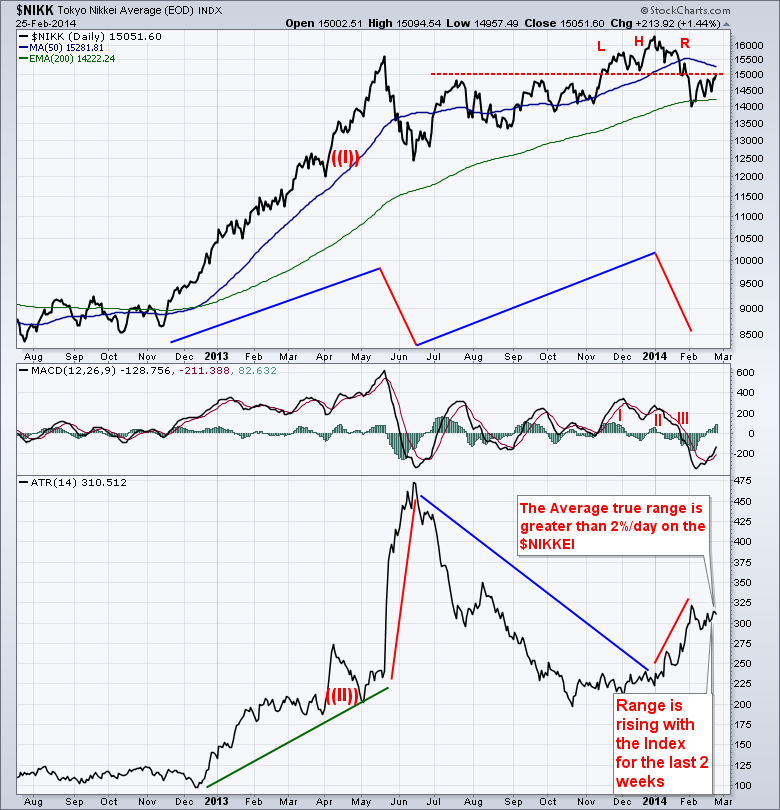
The $INDU rose over 200 points on Monday and settled back to keep about 1/2 the day's gain. This was a 200 point range or over 1% for the day. In North America we consider that to be a meaningful big day... Read More
Don't Ignore This Chart! February 25, 2014 at 07:17 PM
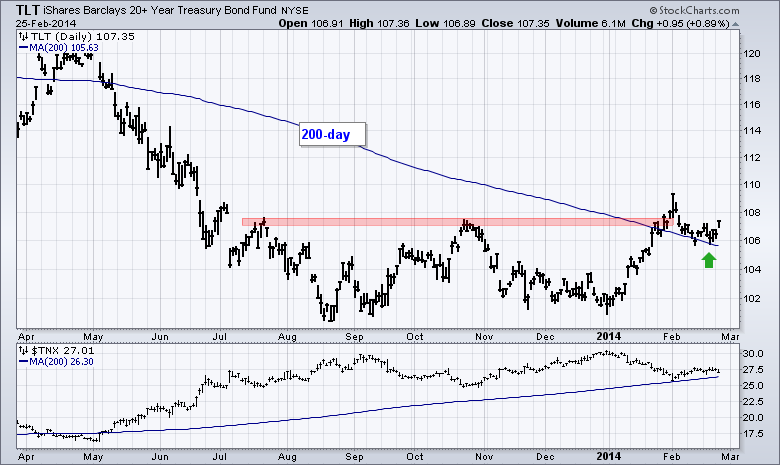
Treasuries caught a bid as the 20+ YR T-Bond ETF (TLT) surged almost 1% and the 10-YR Treasury Yield ($TNX) fell back to 2.7%. Both are above their 200-day moving averages, but TLT is bouncing off the 200-day and $TNX falling towards the 200-day... Read More
Don't Ignore This Chart! February 24, 2014 at 07:08 PM
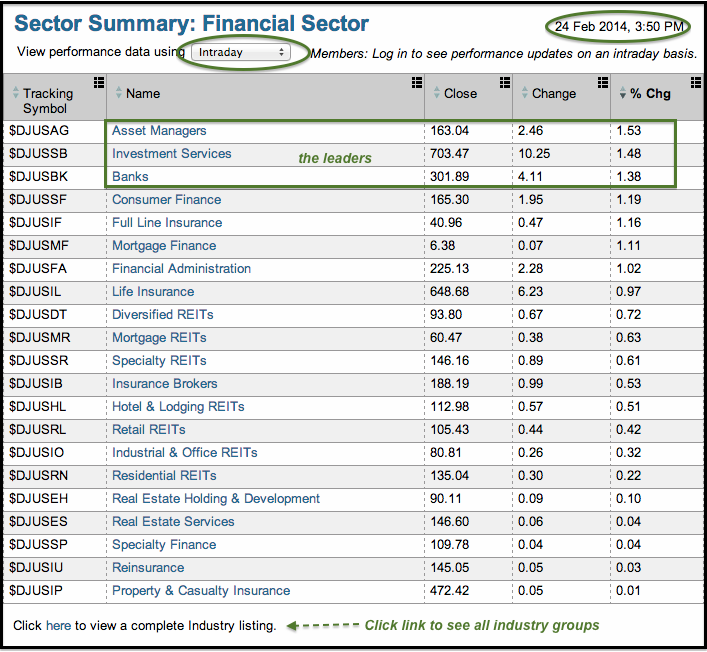
The bulls lifted the Finance SPDR (XLF) with the DJ US Asset Managers Index, the DJ US Investment Services Index ($DJUSSB) and the DJ US Bank Index ($DJUSBK) leading the charge. All three were up more than 1%... Read More
Don't Ignore This Chart! February 22, 2014 at 06:18 AM
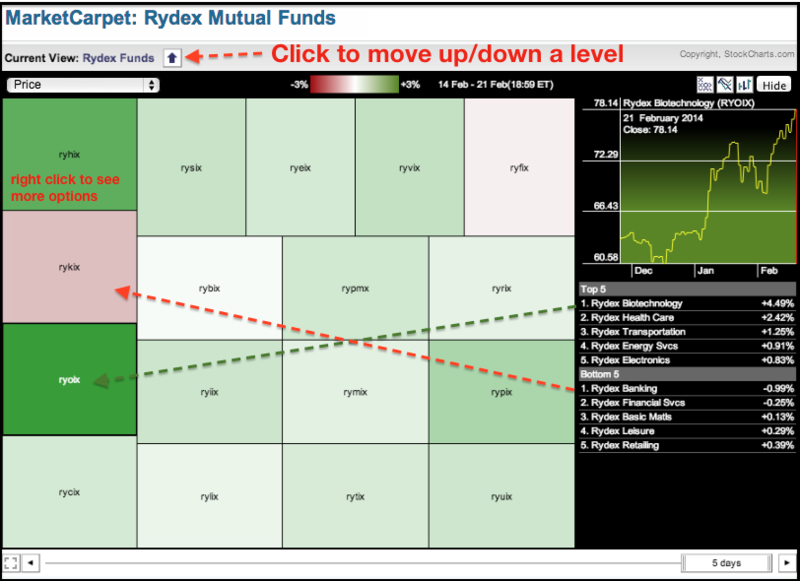
Stocks moved higher this week, but not all groups participated. As the Rydex industry fund MarketCarpet shows, the Financial Servives Fund (RYFIX) and the Banking Fund (RYKIX) declined and underperformed the market... Read More
Don't Ignore This Chart! February 20, 2014 at 03:34 PM
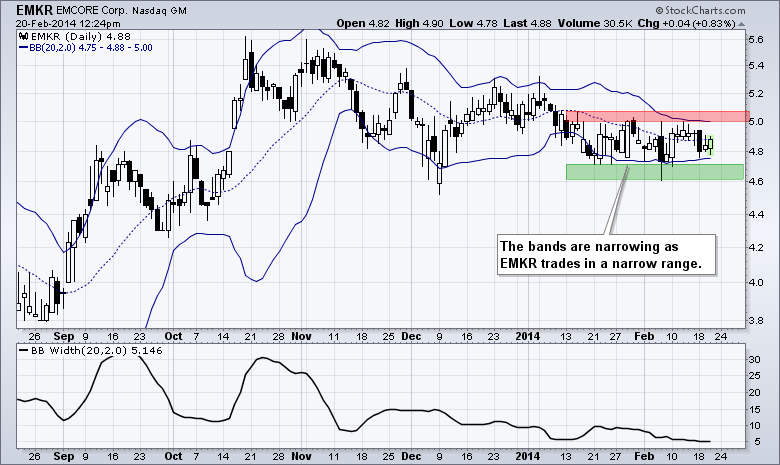
The Bollinger Bands are narrowing for Emcore (EMKR) as the stock moves into a tight consolidation. The indicator window confirms as BandWidth dipped to its lowest level in over six months. This volatility contraction could give way to a volatility expansion. A move above 5... Read More
Don't Ignore This Chart! February 19, 2014 at 01:24 PM
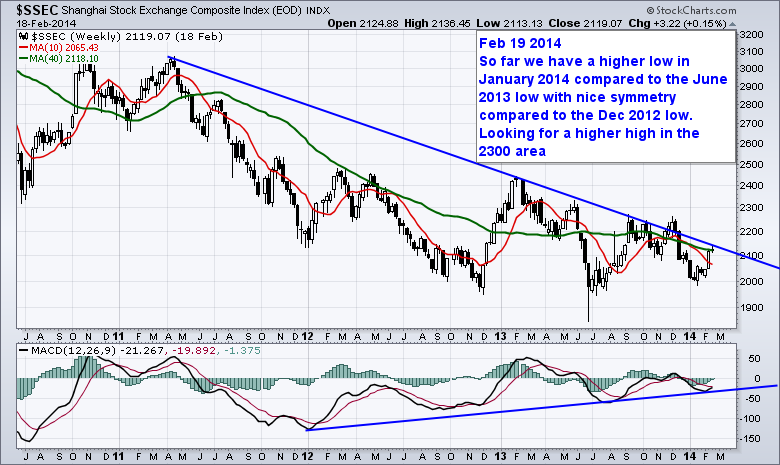
The $SSEC (Shanghai Composite) has been in a funk since 2011. It is approaching a meaningful area to look for a bullish reversal of the downtrend. As technicians, this is where we would expect to see the behavior change... Read More
Don't Ignore This Chart! February 19, 2014 at 01:14 PM
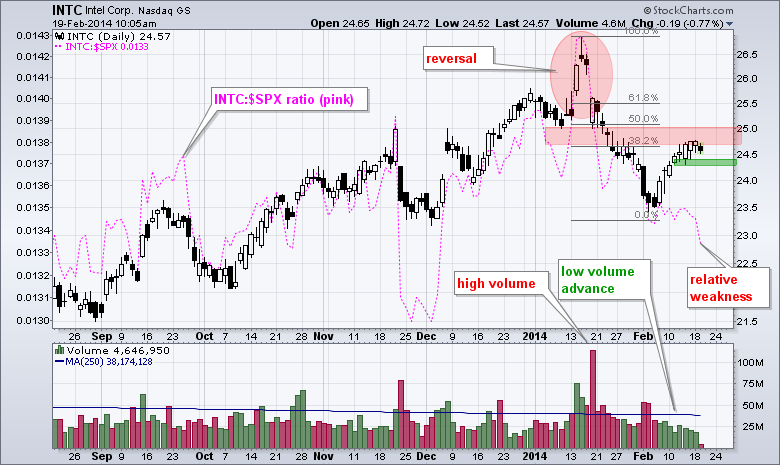
The stock market surged over the last few weeks with the Nasdaq 100 leading the way. Intel also moved higher, but lagged as the price relative (INTC:$SPX ratio) hit a new low for the year this week... Read More
Don't Ignore This Chart! February 18, 2014 at 05:36 PM
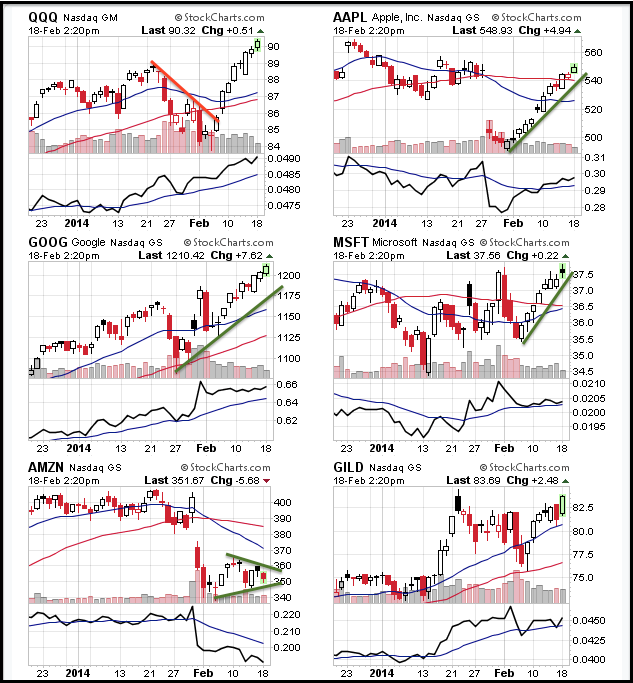
The CandleGlance charts show the Nasdaq 100 ETF (QQQ) and its top five components (the video shows the top ten components). It is easy to see why QQQ is so strong... Read More
Don't Ignore This Chart! February 14, 2014 at 08:05 PM
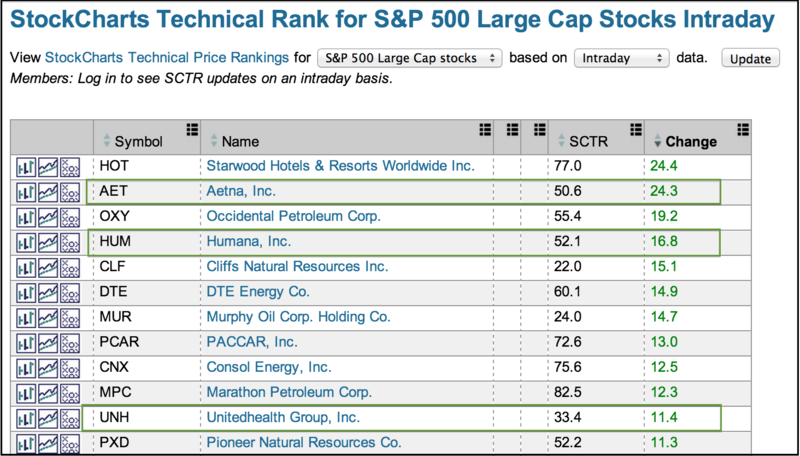
The StockCharts Technical Rank (SCTR) shows relative performance for the S&P 500 stocks, S&P SmallCap 600 and S&P MidCap 400. Stocks with the highest values show the most relative strength... Read More
Don't Ignore This Chart! February 13, 2014 at 03:15 PM
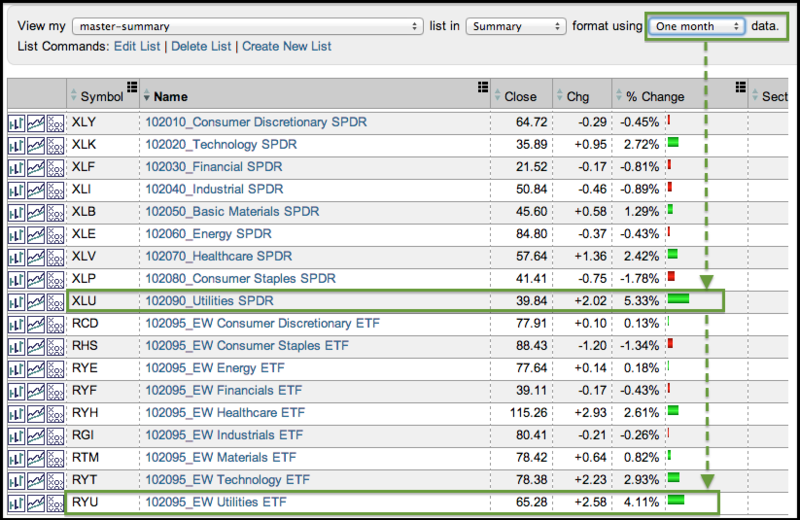
The screen shot below comes from a ChartList viewed in "summary" format using a one month price change. Overall, the market is quite mixed with five of the sector SPDRs down over the past month and only four up... Read More
Don't Ignore This Chart! February 12, 2014 at 03:30 PM
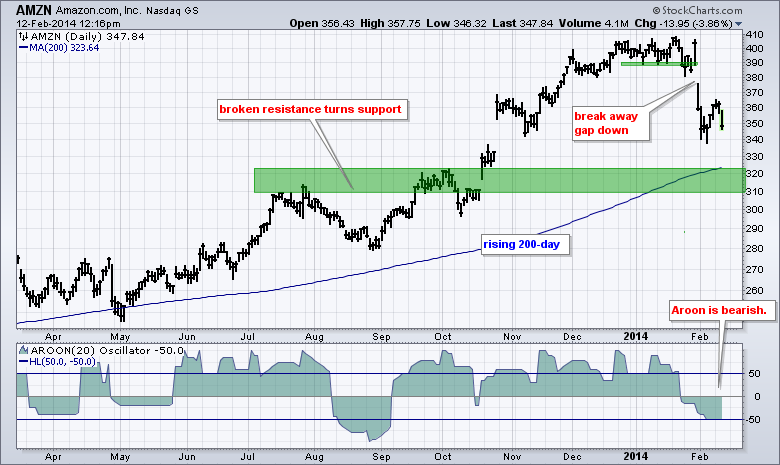
Amazon (AMZN), the biggest internet retailer in the world, was immune to weakness in the retail group for most of January, but finally broke down with a break away gap. After an oversold bounce above 360, the stock is continuing lower today with a move below 350... Read More
Don't Ignore This Chart! February 11, 2014 at 08:33 PM
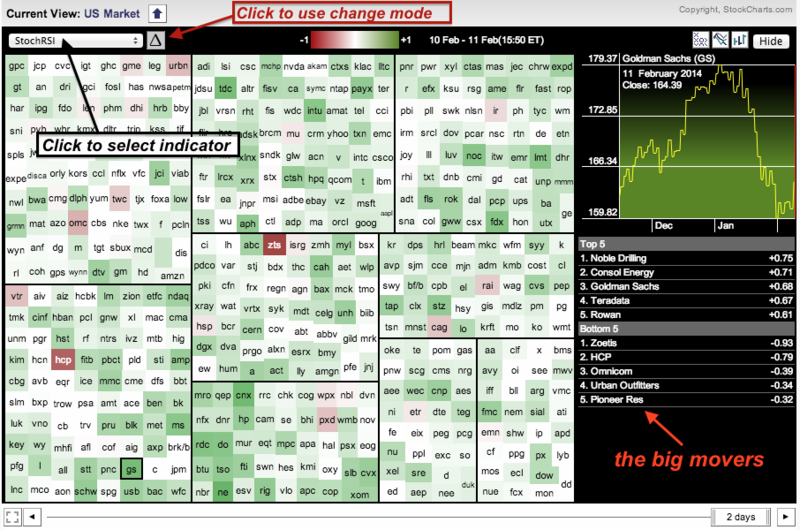
Looking for the big momentum movers? Check out the MarketCarpet using StochRSI in change mode. StochRSI is the Stochastic Oscillator applied to RSI, which makes it RSI on steroids. Clicking the change icon at the top shows the big movers... Read More
Don't Ignore This Chart! February 10, 2014 at 06:52 PM
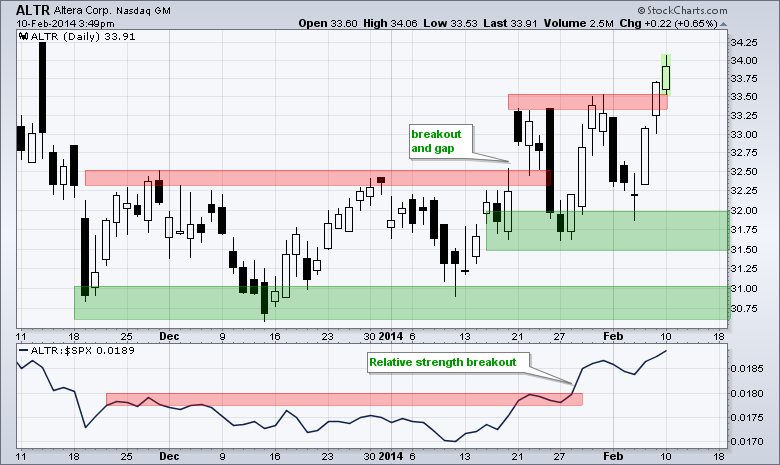
Altera, which is part of the semiconductor group, is showing relative strength this year with a price breakout and new high for the year (2014). The stock established support from mid November to mid January and broke out with a gap in January... Read More
Don't Ignore This Chart! February 10, 2014 at 02:20 PM
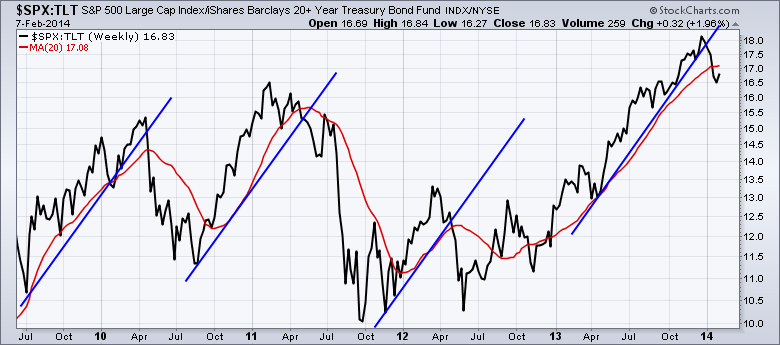
Weekends give us the time to flip through a lot of random charts. One of my favorites is ratios of different asset classes. This one has been very informative. SOme would say the trend lines are to steep. Look at the chart and then we can decide... Read More
Don't Ignore This Chart! February 07, 2014 at 01:21 PM
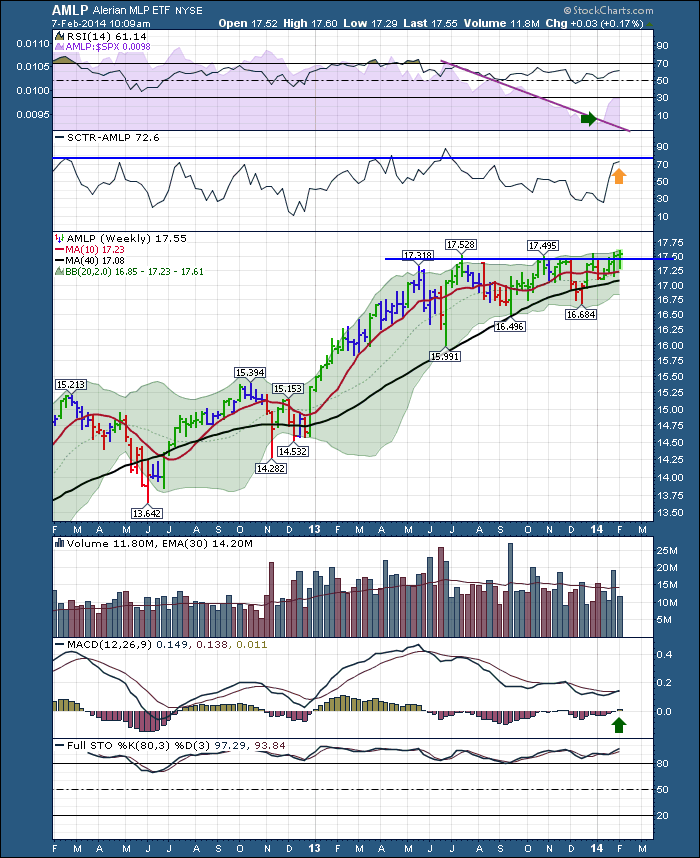
The master limited partnership investment strategy usually has consistent cash flows. Here is an interesting ETF that holds 25 Infrastructure MLP's. This could be considered a defensive area but it still had 18% gains last year... Read More
Don't Ignore This Chart! February 07, 2014 at 12:48 PM
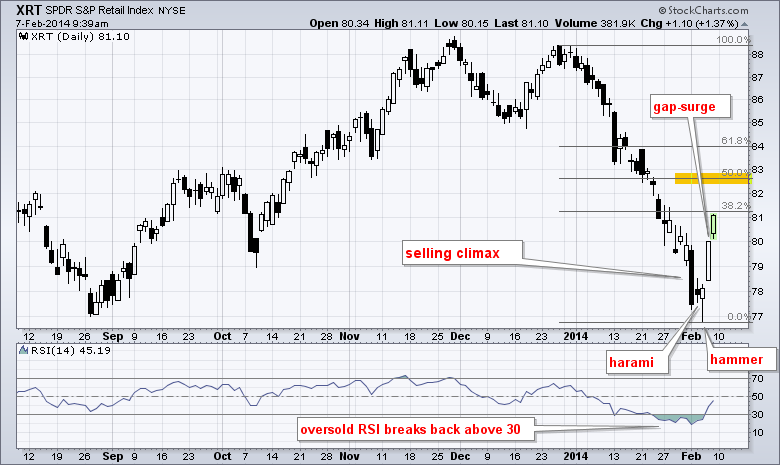
After a plunge below 78 to start the week, the Retail SPDR (XRT) firmed with a harami on Monday-Tuesday and then formed a hammer on Wednesday. These are bullish candlestick reversal patterns that require confirmation, which came with a gap and surge to 80... Read More
Don't Ignore This Chart! February 06, 2014 at 05:03 PM
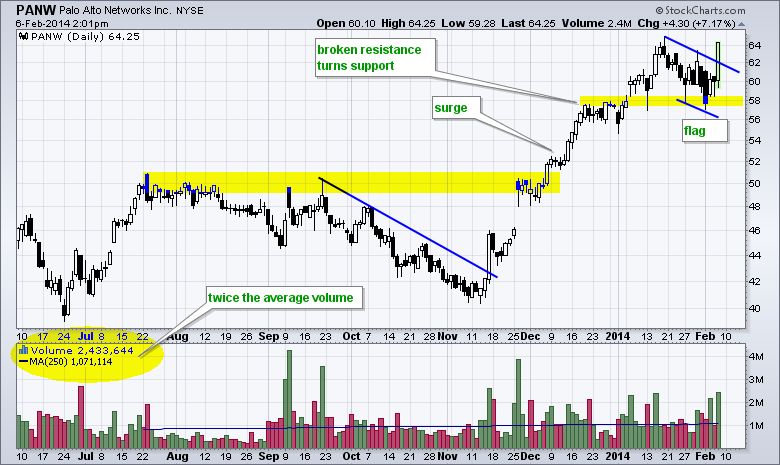
Network security company Palo Alto Networks is resuming its uptrend with a flag breakout on twice its average volume. PANW surged to a new high earlier this year and pulled back with a flag the last few weeks. Notice that broken resistance turned into support in the 58 area... Read More
Don't Ignore This Chart! February 05, 2014 at 03:02 PM
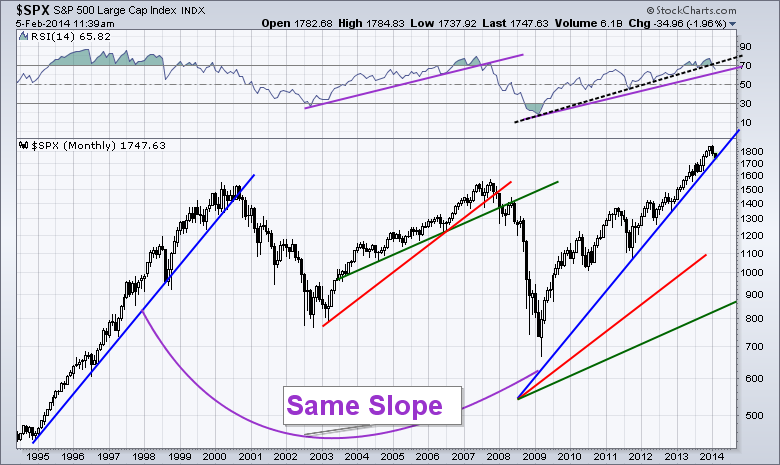
We always focus on the shorter term charts, but the big institutions focus on Monthly and Quarterly charts. Looking at the long timeline, the chart reveals some interesting trend lines. Lines of the same color are also the same slope... Read More
Don't Ignore This Chart! February 05, 2014 at 02:51 PM
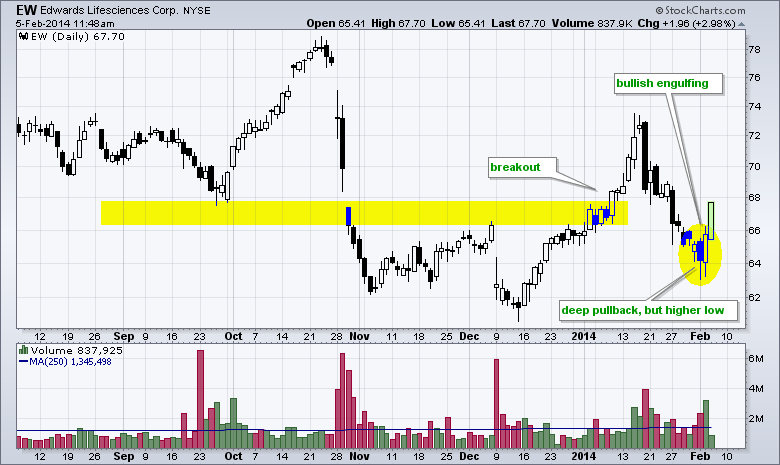
Edwards Life Sciences (EW) has been underperforming the biotech group for over a year, but the stock showed signs of buying interest with a bullish engulfing on high volume and follow through surge on Wednesday... Read More
Don't Ignore This Chart! February 04, 2014 at 06:43 PM
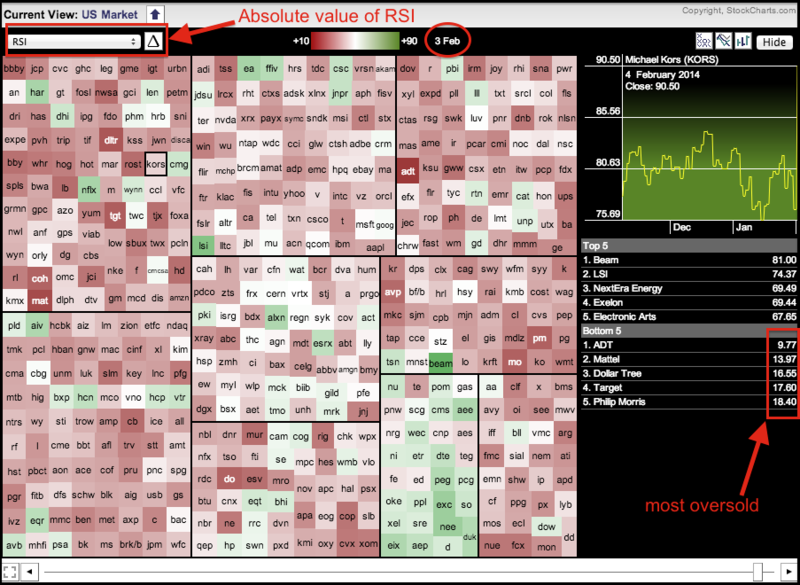
Stocks took a beating over the last few weeks, and some more than others. The Sector MarketCarpet below reflects the absolute value for RSI on February 3rd. Stocks with low RSI values have dark red squares, while stocks with relatively high values have green squares... Read More
Don't Ignore This Chart! February 03, 2014 at 12:54 PM
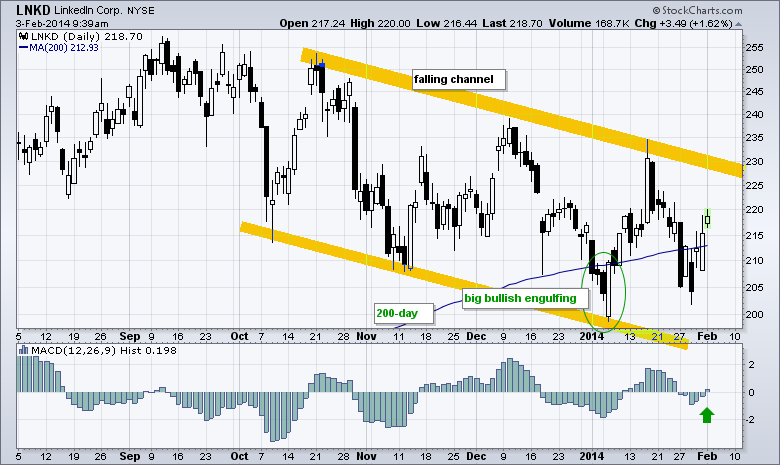
It has been a rough few months for LinkedIn as the stock fell from the 255 area in September to the 200 area in early December. The stock, however, is finding some support near the rising 200-day moving average with a big bullish engulfing... Read More