Don't Ignore This Chart! May 29, 2014 at 05:00 AM
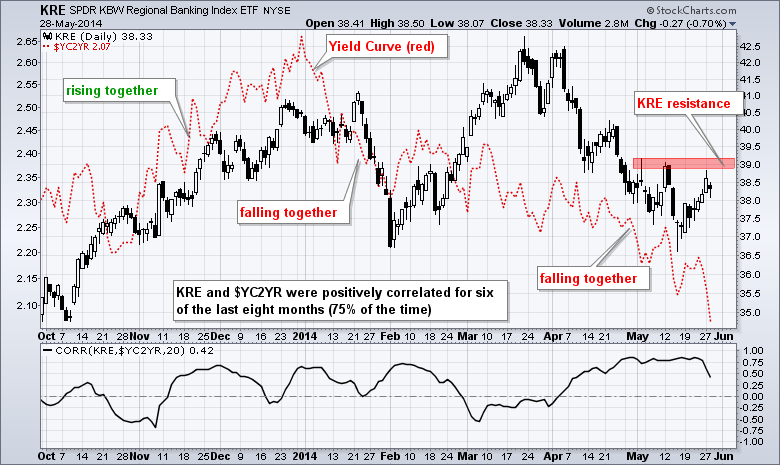
While falling yields translate into lower borrowing costs for the borrower, they are not always positive for the lender... Read More
Don't Ignore This Chart! May 28, 2014 at 05:54 AM
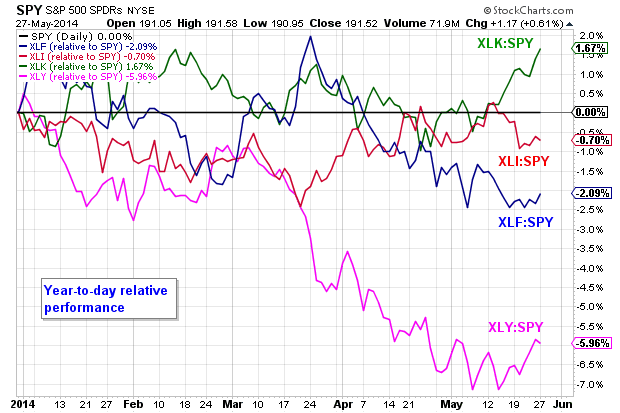
The chart below shows year-to-date relative performance for four sector SPDRs (XLK, XLF, XLI and XLY). Notice that the XLK:SPY ratio shot up over the last two weeks and moved to its highest level of the year (above the February peak)... Read More
Don't Ignore This Chart! May 27, 2014 at 03:11 PM
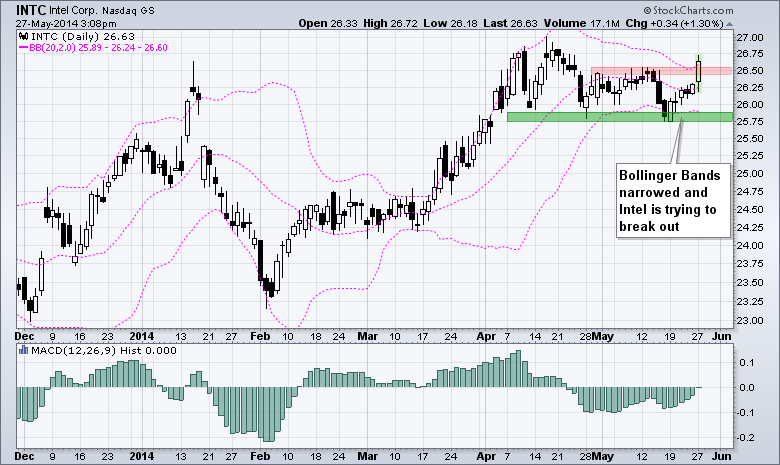
Intel (INTC) is leading the semiconductor group higher with a move above its upper Bollinger Band. Notice how the bands contracted as volatility narrowed over the last few weeks. The breakout signals what could be the start of a volatility expansion and continuation higher... Read More
Don't Ignore This Chart! May 23, 2014 at 11:49 AM
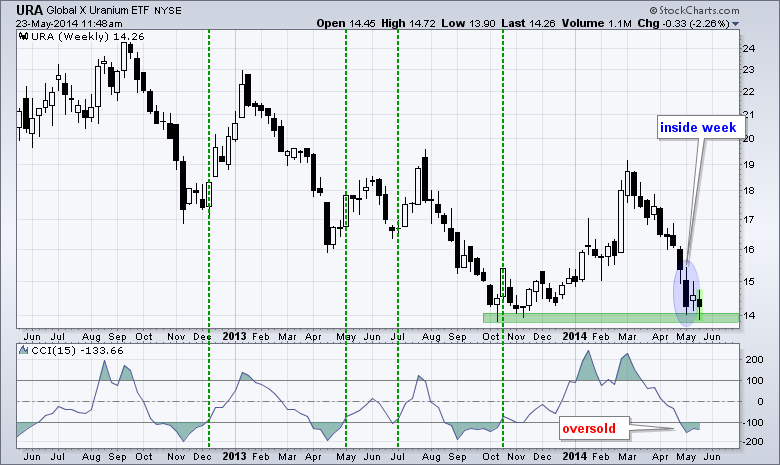
The Global Uranium ETF (URA) has had a tough eleven weeks with a decline from 19 to 14, but support may be at hand. The October-November lows marked support in the 14 area and the ETF firmed here with an inside week last week. Also notice that CCI is oversold... Read More
Don't Ignore This Chart! May 21, 2014 at 04:42 PM
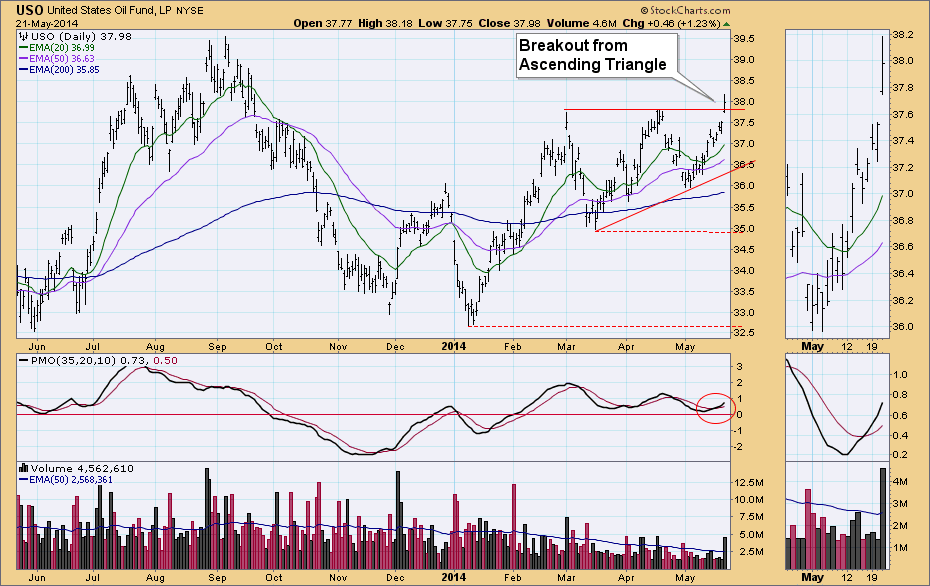
Today, USO broke out above overhead resistance from the bullish ascending triangle. This move confirms the PMO BUY signal that was generated two days ago when the PMO crossed above its 10-EMA. This breakout came on high volume which is positive... Read More
Don't Ignore This Chart! May 21, 2014 at 05:11 AM
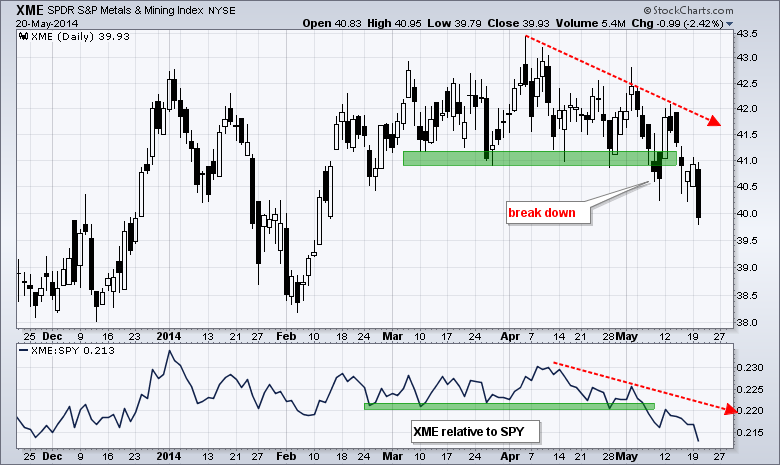
After stalling in March and April, the Metals & Miners SPDR (XME) turned lower in May and broke a key support zone. Notice how XME held the 41 area for two months and then broke this zone twice in May... Read More
Don't Ignore This Chart! May 19, 2014 at 12:02 PM
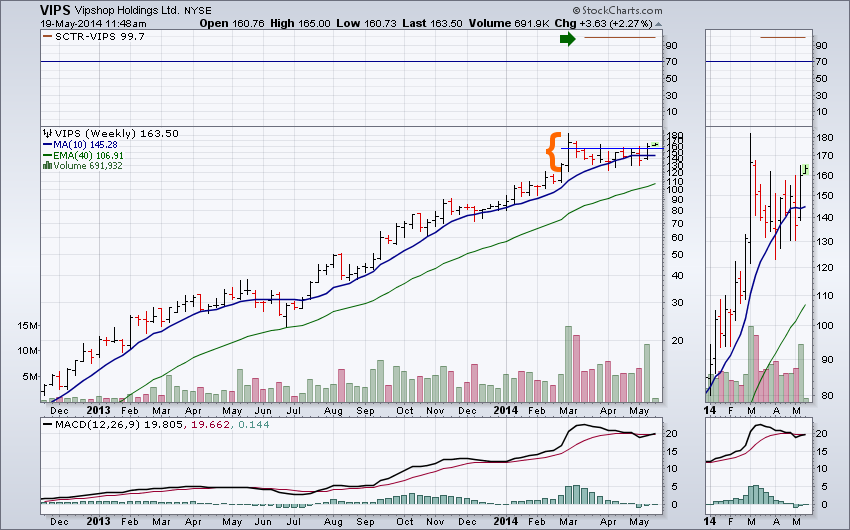
VIPS is an online shopping site for the Chinese market. Bottom left to top right is the simplest way to describe the chart action. What makes the story more compelling is the recent price action. This stock has closed higher almost every month... Read More
Don't Ignore This Chart! May 15, 2014 at 11:57 AM
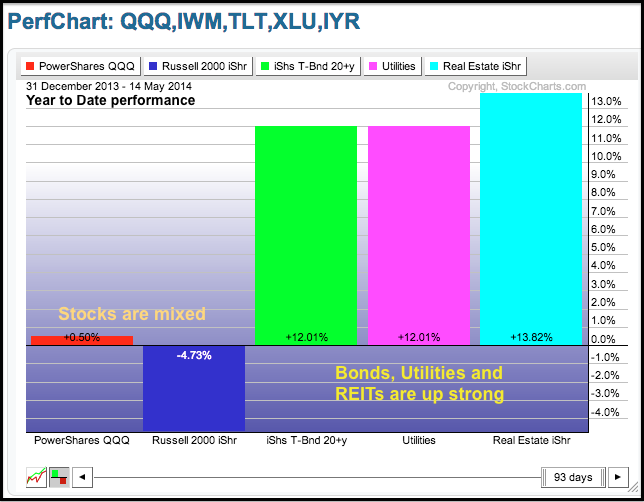
Pimco's Bill Gross called his new secular investment theme "the new neutral". Gross expects slow economic growth and low real interest rates over the next five years, and this will fuel the hunt for yield... Read More
Don't Ignore This Chart! May 14, 2014 at 12:38 PM
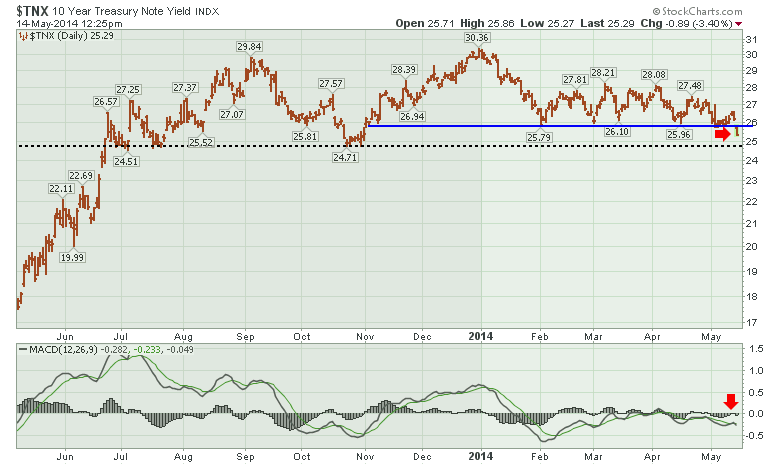
The 10 Year Bond Yield fell to new lows for 2014 today and made 6 month lows. This has been building for a while. There is one layer of horizontal support left for yields at 2.47% which is marked by the red line... Read More
Don't Ignore This Chart! May 12, 2014 at 04:04 PM
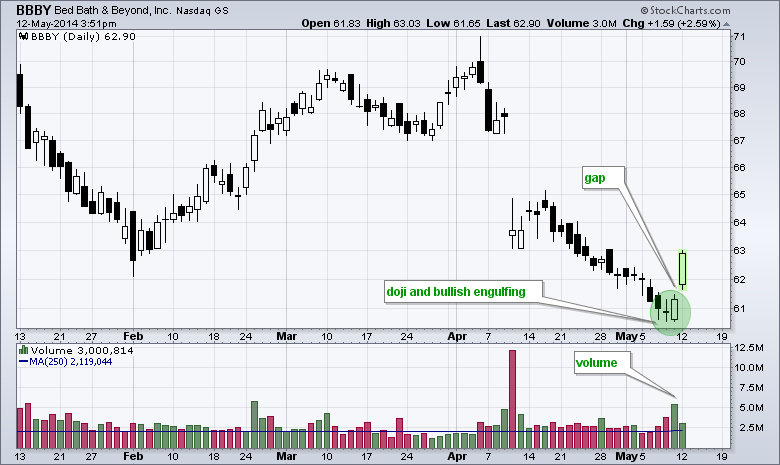
Bed Bath & Beyond (BBBY), which is part of the important retail group, is showing strength with a gap and surge. Notice that this gap-surge came after the stock formed a doji and then a bullish engulfing... Read More
Don't Ignore This Chart! May 10, 2014 at 09:39 AM
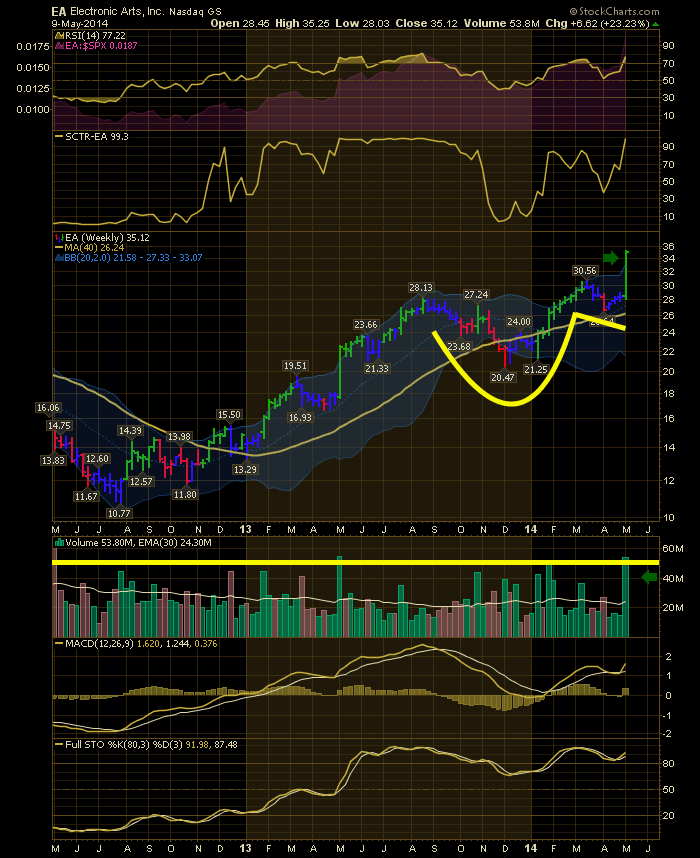
For many investors, the large basing patterns with breakouts are favorites. In the case of Electronic Arts (EA), the stock built a text book consolidation formation at a high level and then broke out. It is commonly called a cup with handle... Read More
Don't Ignore This Chart! May 09, 2014 at 12:20 PM
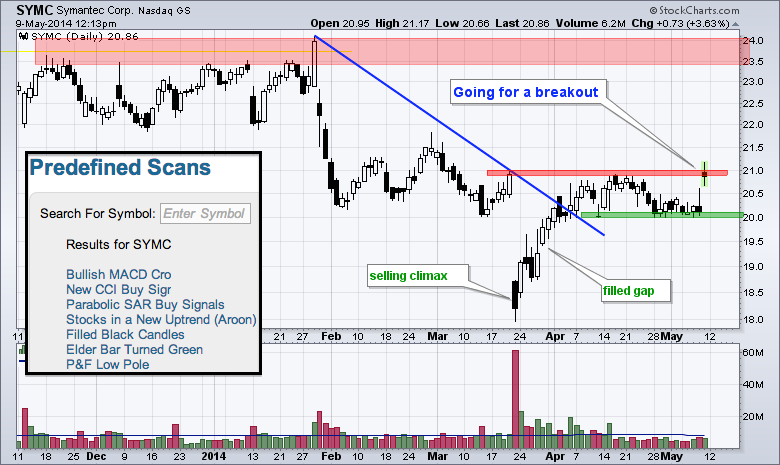
Symantec is popping after reporting earnings on Thursday. The chart below shows the stock with a selling climax in mid March, a recovery into early April and a consolidation the last few weeks. With today's gap, the stock is on the verge of a consolidation breakout... Read More
Don't Ignore This Chart! May 08, 2014 at 04:00 PM
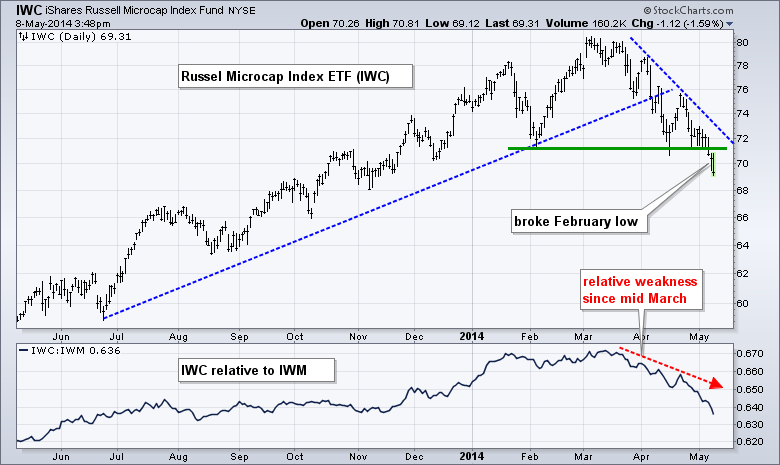
Small-caps are underperforming large-caps and microcaps are underperforming small-caps. Microcaps are similar to the momentum names in that they represent the high beta end of the stock market... Read More
Don't Ignore This Chart! May 07, 2014 at 03:20 PM
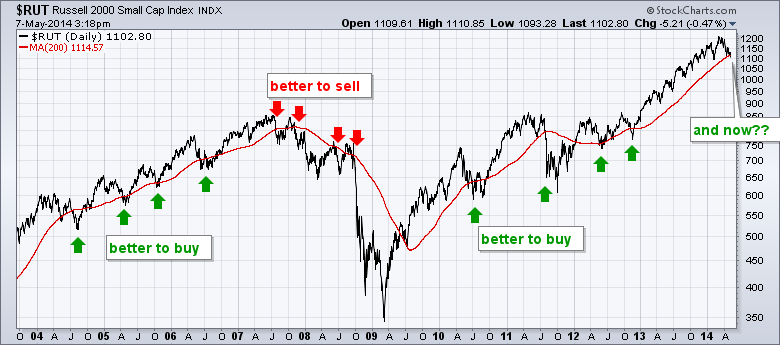
For the first time in over a year, the Russell 2000 closed below its 200-day moving average. This may seem like a long-term sell signal, but it really depends on the bigger trend. Notice how one would have been better off buying on breaks below the 200-day in 2004, 2005 and 2006... Read More
Don't Ignore This Chart! May 06, 2014 at 01:25 PM
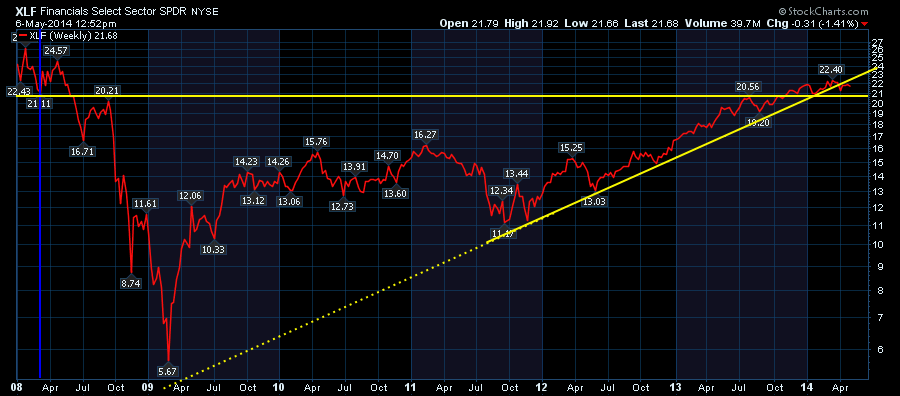
The XLF ETF - Financial SPDR - is one of the most influential ETF's to support the long term bull market. Bank managers see financial issues before other sectors and the broad array of industries within the financial sector can mask the actual performance of XLF... Read More
Don't Ignore This Chart! May 05, 2014 at 10:00 AM
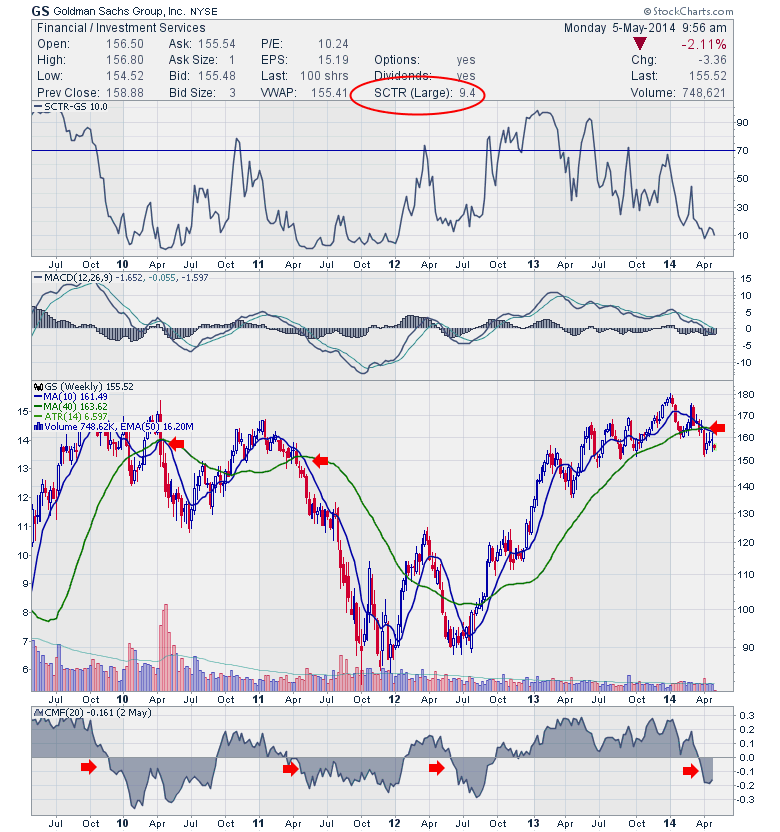
Goldman is one of the most prmoninent stocks in the market. Brokers are considered a leading indicator. Here we have Goldman trapped under the 40 WMA. Looking back we can see Goldman has been early in rolling over before markets correct... Read More
Don't Ignore This Chart! May 01, 2014 at 12:40 PM
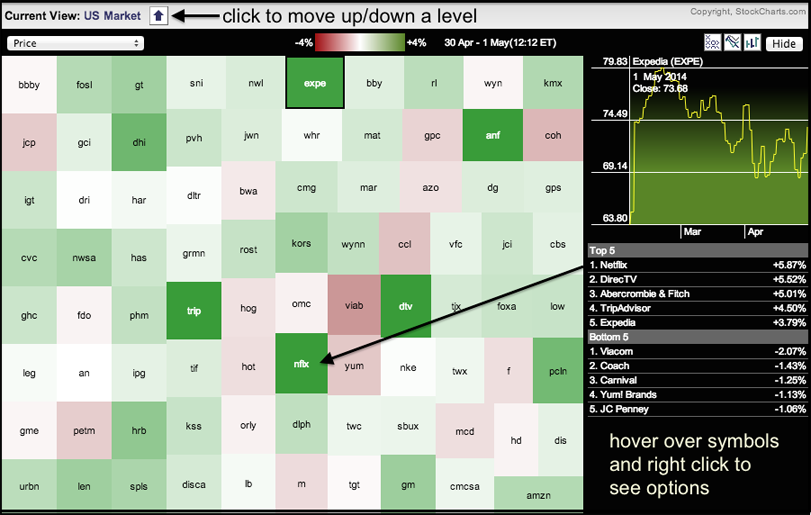
The Consumer Discretionary SPDR (XLY) was leading the sectors at midday on Thursday. Trading in general was rather lackluster, but it is still positive to see some leadership from this economically sensitive sector... Read More