MailBag September 24, 2010 at 03:55 PM
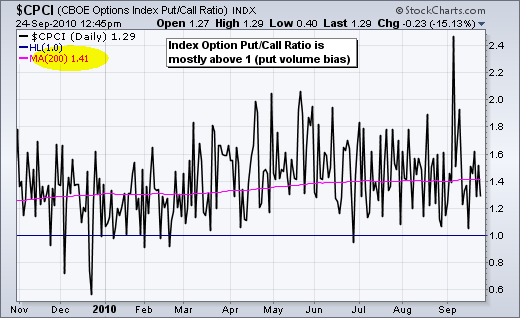
There are three CBOE Put-Call Ratios available from StockCharts.com: the CBOE Equity Put/Call Ratio ($CPCE), the CBOE Index Put/Call Ratio ($CPCI) and the CBOE Total Put/Call Ratio ($CPC). First, a little background. The Put-Call Ratio equals put volume divided by call volume. Put options increase in value during a decline. Call options increase in value during an advance. The Put-Call Ratio is above 1 when put volume exceeds call volume and below 1 when call volume exceeds put volume. Analysts use the Put-Call Ratio as a sentiment indicator. Sentiment is considered excessively bullish Read More
MailBag September 17, 2010 at 10:22 AM
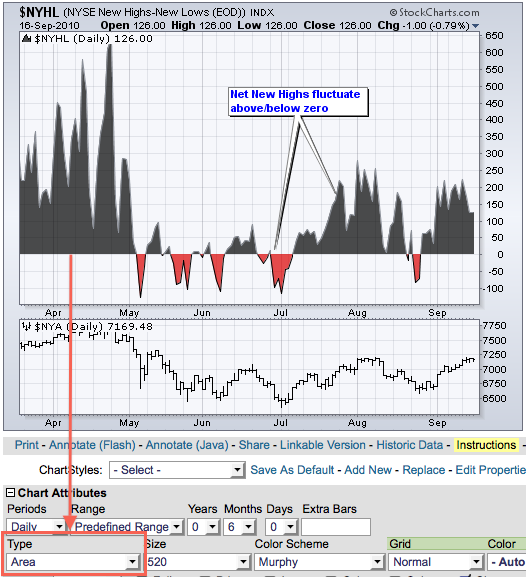
What’s the difference between Net New Highs and Cumulative Net New Highs? Net New Highs is simply the difference between new 52-week highs and new 52-week lows. For example, Net New Highs would be +80 if there were 100 new highs and 20 new lows. Daily statistics fluctuate along with the market. Net New Highs are generally positive when the market is moving higher and lower when the market is moving lower. Over a period of time, Net New Highs will fluctuate above and below the zero line, similar to an oscillator. Sustained market advances will show consistently positive Net New Highs Read More
MailBag September 10, 2010 at 09:17 AM
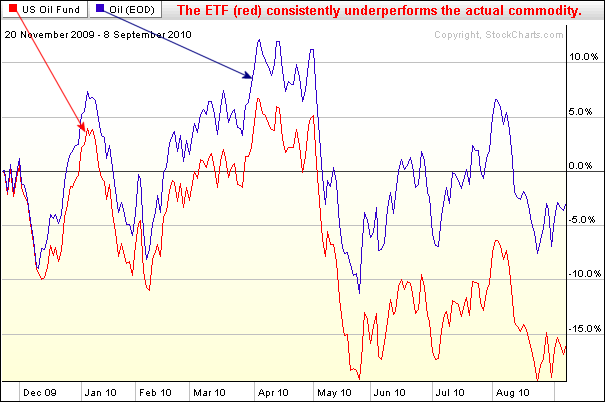
Do commodity related ETFs perform in line with the underlying commodity? This is an important question that traders and investors need to answer before considering commodity-related ETFs. In fact, this also applies to index ETFs, especially ETFs based on foreign indices. Chartists can easily compare performance of an ETF and the underlying commodity using PerfCharts at StockCharts.com. While commodity ETFs are generally good for trading, associated costs and duplication issues sometimes negatively affect performance. Take for instance oil and the US Oil Fund ETF (USO). The US Oil Fund ETF Read More
MailBag September 03, 2010 at 09:56 AM
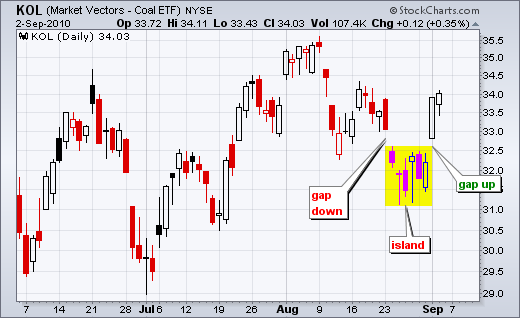
An island reversal is short-term reversal pattern that forms with two overlapping gaps. Traders with positions taken between the two gaps are stuck with losing positions. A bullish island reversal forms with a gap down, short consolidation and gap up. A bearish island reversal forms with a gap up, short consolidation and gap down. Technically, the gaps should overlap to create an empty space above or below the island. The chart below shows the Coal ETF (KOL) with a bullish island reversal this week. Notice that the gap down and the gap up created a space above the island without any Read More