MailBag February 25, 2011 at 09:52 AM
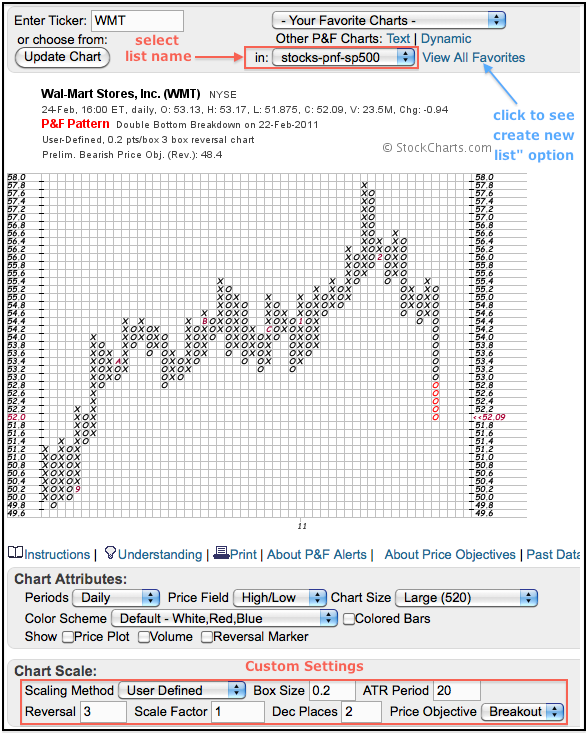
SharpCharts subscribers have the ability to create a customized P&F chart style and then apply it to all securities in a favorites list. This makes it simple to scroll through a security list looking for P&F signals. The first step is to create a favorites list or use an existing one. Select a favorites list from the drop-down at the top or access the “create new list” option by clicking “view all favorites”. Second, open a chart in this favorites list. Third, convert it to a P&F chart by clicking the “point & figure chart” link at the bottom of the page with the chart Read More
MailBag February 18, 2011 at 08:48 AM
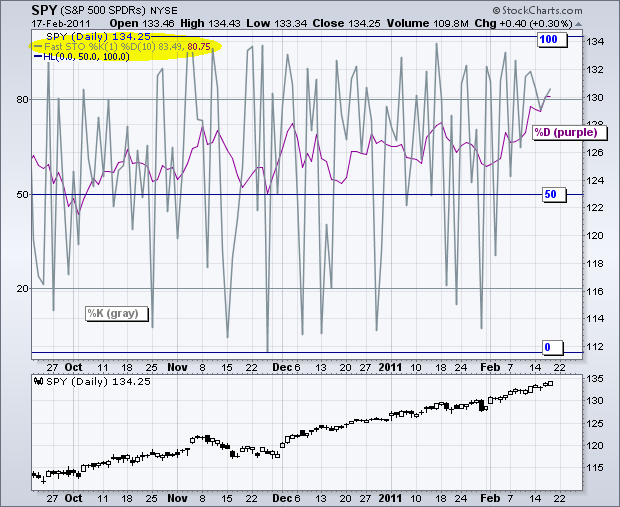
A 1-period Fast Stochastic Oscillator can be used to measure the strength or weakness of the close on a daily basis. Daily readings in this classic indicator reflect the level of the close relative to the high-low range. A close at the high equals 100 and a close at the low equals 0. Closes at the exact high or exact low are rare. We can however, assume, that readings between 80 and 100 reflect a strong close, while readings between 0 and 20 indicate a weak close. Overall, the 1-period Fast Stochastic Oscillator is above 50 when the close is above the mid point of the high-low range and Read More
MailBag February 11, 2011 at 09:39 AM
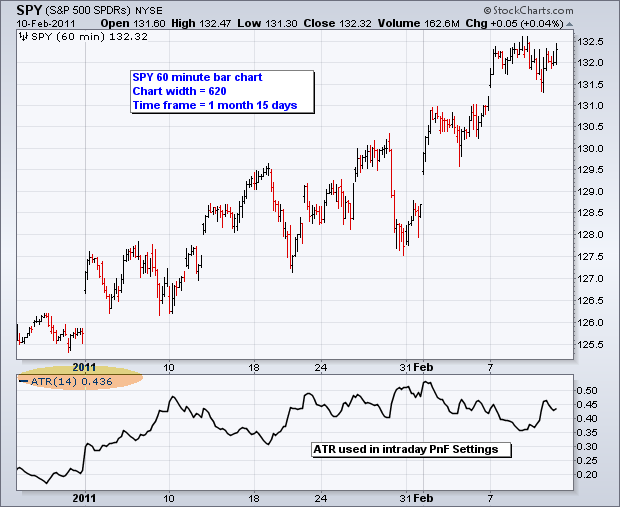
Intraday charts are normally associated with short-term analysis that extends anywhere from several days to several weeks. Even with the largest intraday timeframe, 60 minutes, bar charts get crowded with more than seven weeks of data. The chart below shows 60-minute bars for SPY going back 1 month and 15 days. This chart, size 620, is full with no room for more data, unless one chooses a wider chart size, which is possible. If only there were a way to filter out the uneventful moves with the eventful moves. Enter the intraday P&F chart. The P&F chart below is based on Read More
MailBag February 04, 2011 at 10:53 AM
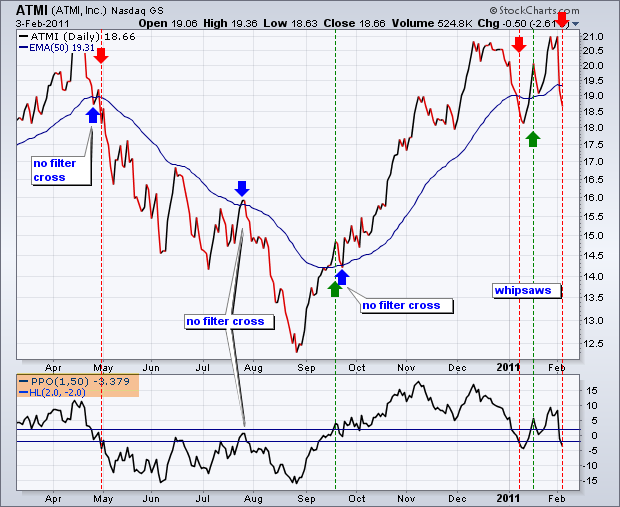
The chance of whipsaw increases as the speed of the indicator increases. Conversely, lag increases as the speed decreases. Chartists are always searching for the sweet spot between speed and lag. As far as indicators and settings are concerned, there is no holy grail. Moreover, the market is constantly changing. What works in a trending market will not work in a flat market. What works in a volatile market will not work in a docile market. When it comes to moving average signals, we can reduce whipsaws by applying a filter. Of course, this comes at the expense of a little lag. Filters can Read More