MailBag January 28, 2011 at 09:21 AM
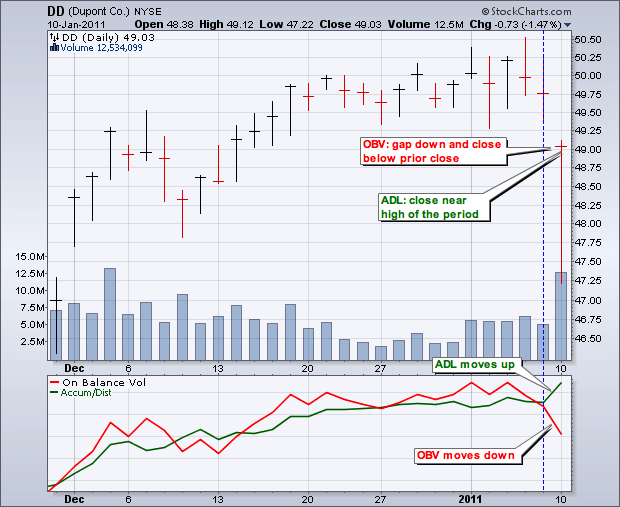
On Balance Volume (OBV) and the Accumulation Distribution Line (ADL) sometimes diverge because their formulas are quite different. Both are cumulative volume-based indicators that measure the flow of volume. OBV is based on the change from one period to the next, but the Accumulation Distribution Line is based on the level of the close relative to the high-low range within a given period. OBV ignores price action within a given period. The Accumulation Distribution Line ignores price action outside a given period. Basically, On Balance Volume rises when the close is up and falls when the Read More
MailBag January 21, 2011 at 09:29 AM
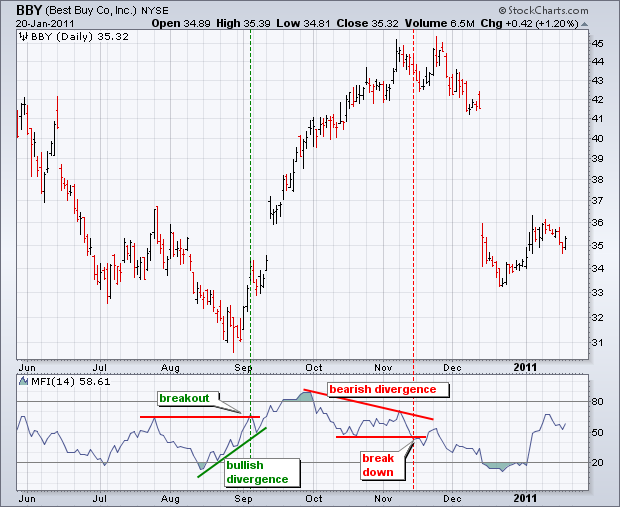
The short answer is yes. More importantly, this indicator is available in SharpCharts as the Money Flow Index (MFI). Developed by Gene Quong and Avrum Soudack, the Money Flow Index measures buying and selling pressure with calculations based on the RSI formula. They refer to their Money Flow Index (MFI) as volume-weighted RSI in an article with Stocks & Commodities Magazine. John Bollinger, a fan of the Money Flow Index, also mentioned this indicator in an interview with the same magazine. This article will not delve into the formula specifics. There is a Money Flow Index (MFI) Read More
MailBag January 14, 2011 at 09:13 AM
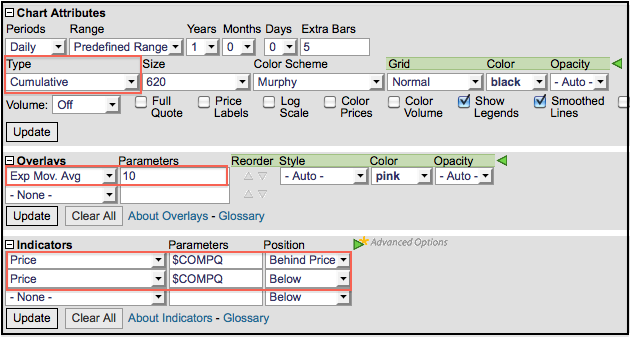
SharpCharts users can select “Cumulative” to plot the AD Line, AD Volume Line and Cumulative Net New Highs. These indicators can be plotted in cumulative format because they fluctuate above and below zero. A cumulative plot is simply a running total of each period’s value. A price series that is always positive is not suited for a cumulative plot. The cumulative selection can be found in “Chart Attributes” under chart “Type”. The base security for the AD Line is Advance-Decline Issues, such as Nasdaq Advance-Decline Issues ($NAAD). The base security for the AD Volume Line is Read More
MailBag January 07, 2011 at 09:05 AM
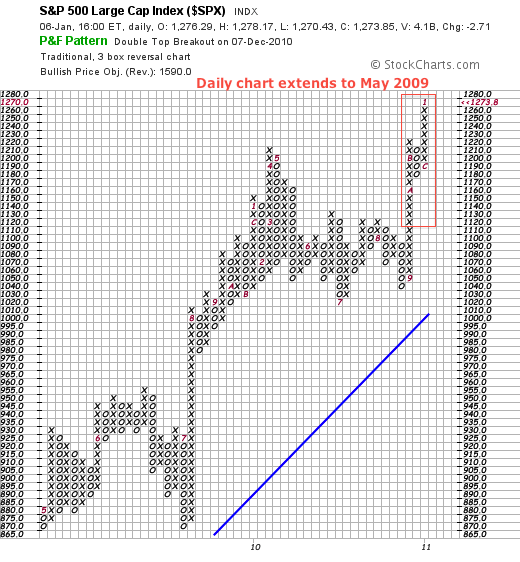
Daily Point & Figure charts often cover a long timeframe and are often best suited for long-term analysis. The chart below shows the S&P 500 daily P&F chart with traditional scaling. This means box size is 5 between 500.01 and 1000, and 10 between 1000 and 2500. This traditional P&F chart extends back to May 2009. Notice the red 5 in the bottom left hand corner. hartists can easily shorten the timeframe and expand sensitivity by selecting an intraday setting. Go to the “periods” setting in “chart attributes” just under the chart.While 60-minute charts might seem short-term Read More