MailBag December 28, 2012 at 08:04 AM
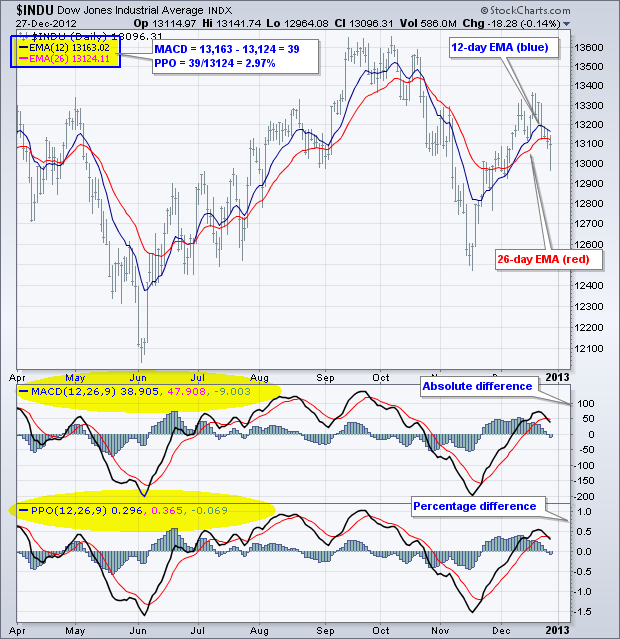
MACD and the Percent Price Oscillator (PPO) are momentum oscillators that measure the difference between two moving averages. MACD(12,26,9) is the absolute difference between the 12-day and 26-day exponential moving averages. PPO(12,26,9) takes MACD one step further by showing the percentage difference between these two moving averages. The PPO is the difference of the two EMAs divided by the 26-day EMA. A 9-day EMA is applied to MACD and the PPO to act as a signal line. The difference between MACD and the PPO can be seen on the Dow chart. Notice that Read More
MailBag December 21, 2012 at 11:08 AM

SharpCharts users can measure correlation at least two ways. First, chartists can compare two securities by plotting the price of one behind the price of the other. Second, chartists can use the Correlation Coefficient to quantify correlation. Positively correlated securities rise and fall together, while negatively correlated securities move in opposite directions. SharpCharts users can add another security to a chart by selecting “price” as an indicator, entering the security’s symbol as the parameter and positioning the security “behind price”. The resulting chart will show the price Read More
MailBag December 14, 2012 at 09:18 AM
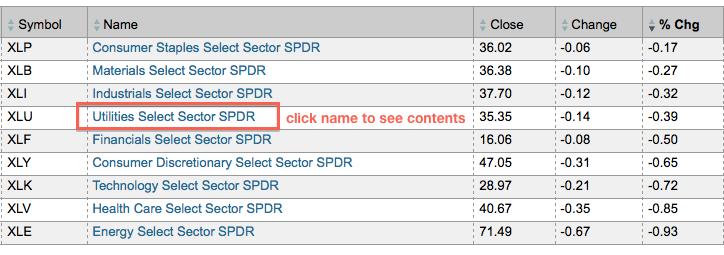
The StockCharts Sector Summary gives chartists the ability to drill down into sectors and industry groups. As it’s name implies, the Sector Summary starts with the nine stock market sectors. Each one of these names has a link. When clicked, chartists will be taken to the industry group level within that sector. In this example, I clicked on the utilities sector to see the industry groups within. The second image shows the five industry groups that make up the utilities sectors. Notice that these tables can be sorted by the column headings Read More
MailBag December 07, 2012 at 11:48 AM
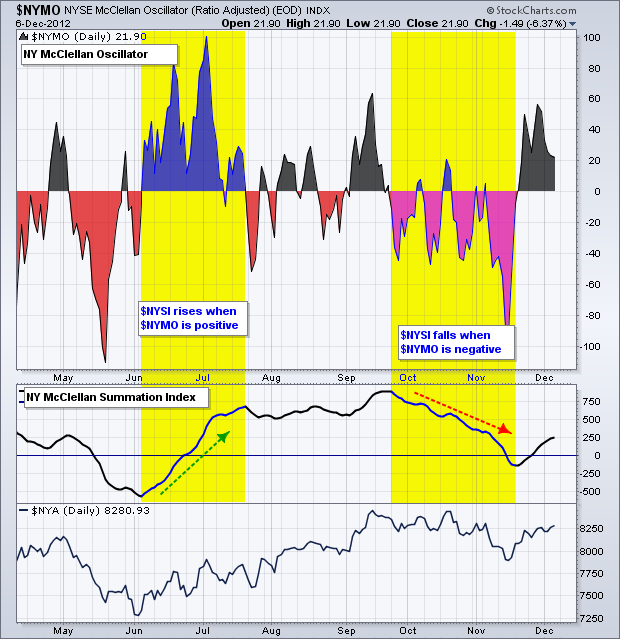
Let’s first start with the McClellan Oscillator. This is the 19-day EMA of Net Advances less the 39-day EMA of Net Advances. Net Advances equals advancing issues less declining issues. Some chartists use ratio-adjusted Net Advances by dividing Net Advances by Advances plus Declines. The McClellan Oscillator is similar to MACD because it is the difference between two moving averages. In this regard, the McClellan Oscillator measures the momentum of breadth (Ratio-Adjusted Net Advances). Notice how it oscillates above/below the zero line. The Read More