MailBag February 01, 2013 at 09:54 AM
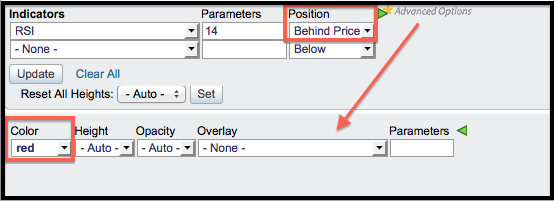
Chartists can place an indicator behind the price plot of the underlying security by using the drop down menu for “position”. After selecting the indicator and parameters, choose “behind price” to place it the main chart window. Positioning an indicator behind the price plot makes it easy to compare indicator movements with price movements. Chartists can use the “advanced” options to change the color for better contrast. In the chart below, we can see that RSI peaked in mid September, which was a few weeks ahead of the Dow’s peak. Both bottomed in mid November and moved higher Read More
MailBag January 25, 2013 at 10:48 AM
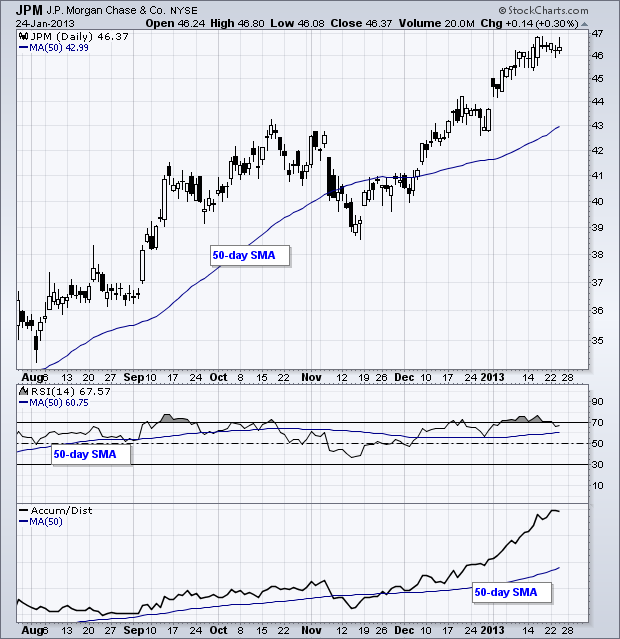
Chartists can add an indicator to an indicator using the “advanced options”, which are just to the right of the selected indicator. Adding a moving average to a momentum oscillator can help chartists identify upturns and downturns. Adding a moving average to the Accumulation Distribution Line can help chartist identify trend changes in this volume-based indicator. The example below shows two indicators with moving averages. First, a 50-period simple moving average was added to RSI. RSI is clearly moving higher when above its 50-day SMA and Read More
MailBag January 18, 2013 at 10:19 AM
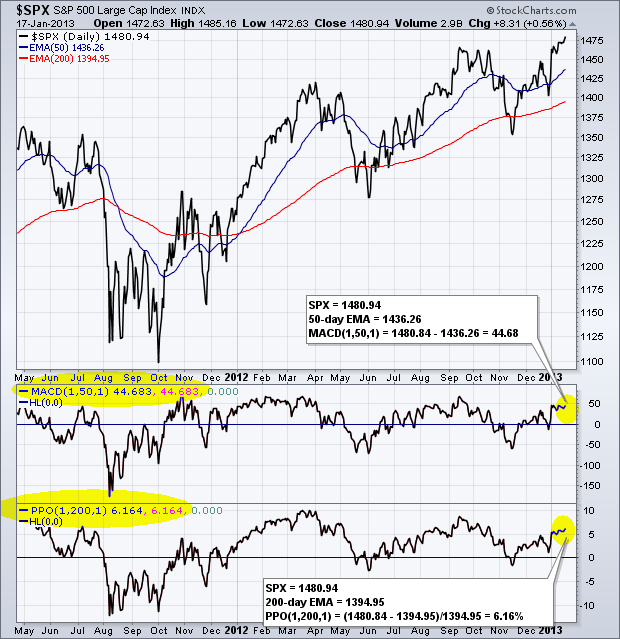
Chartists can use MACD and the Percent Price Oscillator (PPO) to measure the difference between price and an exponential moving average. MACD is the absolute difference between two exponential moving averages. The PPO is the percentage difference between two exponential moving averages. The chart below shows the S&P 500 with the 50-day EMA and 200-day EMA in the main window. MACD (1,50,1) is shown in the first indicator window, while PPO(1,200,1) is shown in the second indicator window. Setting the parameter to a value of 1 means this is a 1-day EMA, which equals the closing price Read More
MailBag January 11, 2013 at 10:00 AM
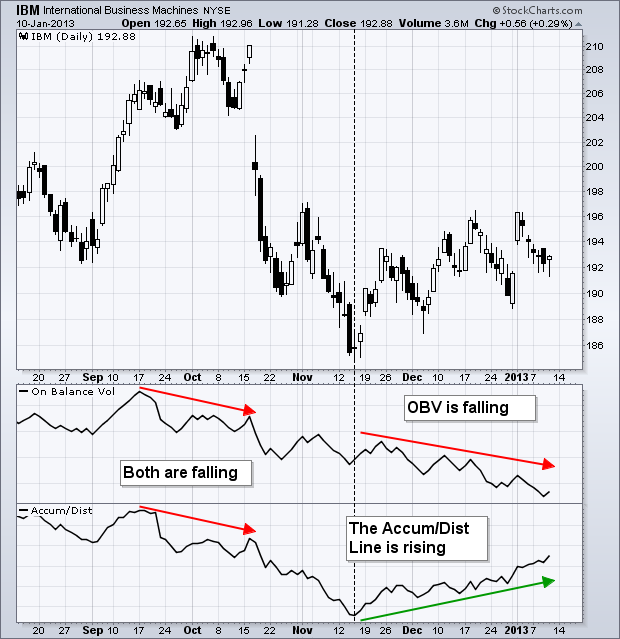
On Balance Volume (OBV) and the Accumulation Distribution Line are cumulative volume-based indicators. The difference between these two indicators is based on the closing price reference. OBV compares the close with the prior period’s close, while the Accumulation Distribution Line compares the close with the period’s high-low range. These two indicators sometimes diverge because they are calculated differently. Developed by Joe Granville, OBV is based on a relatively simple calculation. Volume is added when the stock closes above its prior close and subtracted when the stock closes Read More
MailBag January 04, 2013 at 08:38 AM
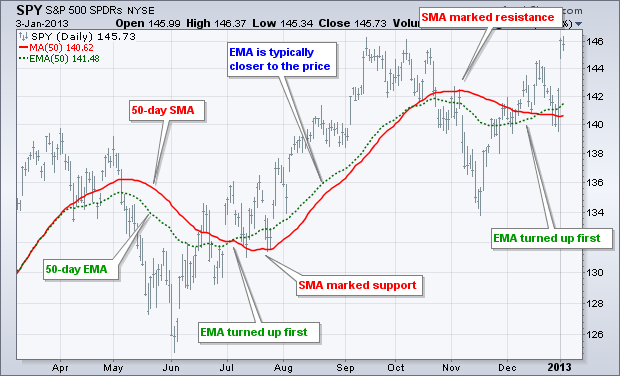
There are two types of moving averages offered on the SharpCharts workbench: simple moving averages and exponential moving averages. As with all averages, both show an average price over a specified look-back period. The 50-day simple moving average (SMA) is the average price over the last 50 days. The exponential moving average (EMA) takes this average one step further by applying more weight to current prices. This reduces the lag and increases the price sensitivity. The chart above shows the S&P 500 ETF (SPY) with the 50-day SMA in red and the Read More