MailBag March 01, 2013 at 09:31 AM
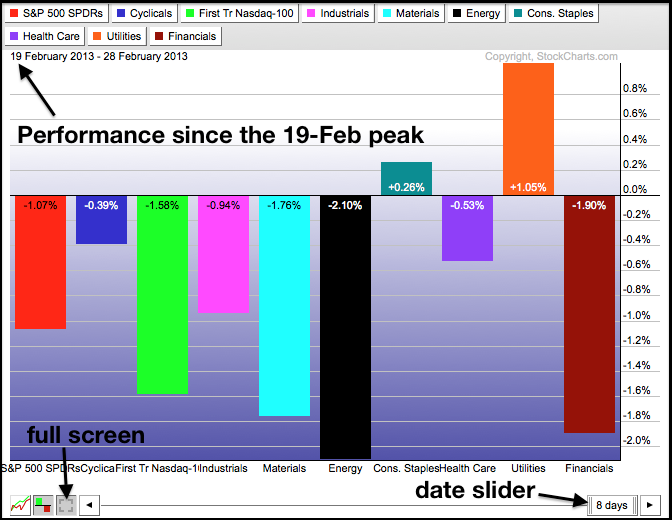
Our HTML5 PerCharts give chartists the flexibility to choose an exact date range using the date slider at the bottom. After opening a PerfChart, double click on the date slider and enter the desired number of days. For example, the S&P 500 ETF (SPY) has yet to exceed its 19-February peak, which makes this date important. Chartists could focus on sector performance since this peak by entering “8” for the number of days in the date slider. This feature makes is possible to base performance on a specific peak or trough in the market. *LINEBR** Read More
MailBag February 22, 2013 at 09:28 AM

StockCharts.com provides Bullish Percent Index symbols for ten sectors, six indices and the gold miners. First, let’s define the Bullish Percent Index (BPI). The BPI is a breadth indicator that shows the percentage of stocks in a given index with Point & Figure (P&F) buy signals. If 60 of the 100 stocks in the S&P 100 are on P&F buy signals, then the bullish percent index would be 60% (60/100 = .60 or 60%). Readings above 50% favor the bulls, while readings below 50% favor the bears. Chartists can also apply basic technical analysis to define the trend and use directional Read More
MailBag February 15, 2013 at 08:37 AM

There is a “search for symbol” box at the top of the pre-defined scans page. By entering a symbol, chartists can learn which predefined scans feature a particular stock, ETF or mutual fund. There are over eighty scans that cover candlesticks, P&F patterns and technical indicators. A search for TripAdvisor (TRIP) returns seven scan results. This means TRIP showed up in these seven scans. Each scan name contains a link that users can click to see the full results. The second screenshot shows the stocks with a breakaway gap down. Users can click on the chart icons to see a SharpChart Read More
MailBag February 08, 2013 at 09:44 AM
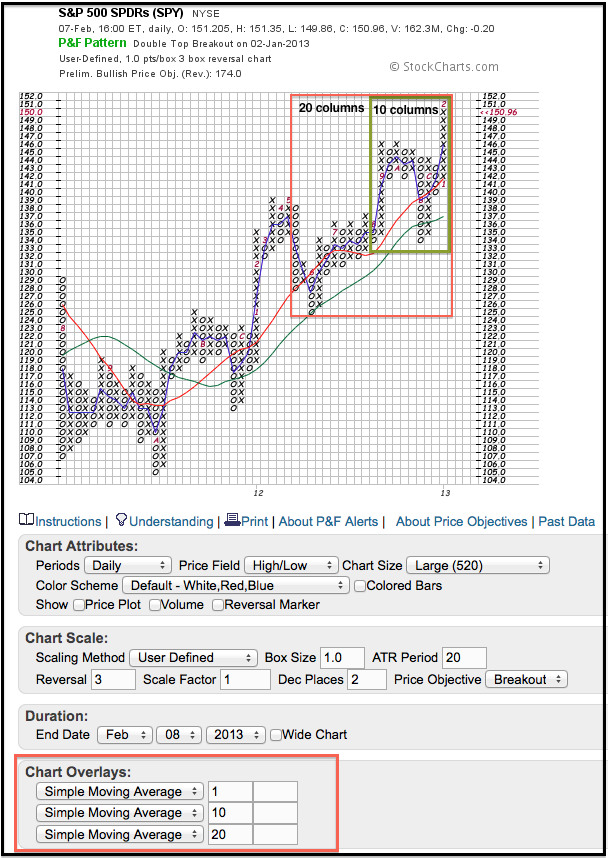
Chartists can overlay four indicators on Point & Figure charts at StockCharts.com. These overlays, which include trend lines, moving averages, Bollinger Bands and Price-by-volume, can be added by using the dropdown menu under the P&F chart. P&F moving averages are based on the average price of each column. A 1-period SMA offers an easy and straightforward example. An X-Column extending from 141 to 151 would have a 1-period SMA equal to 146 [(141 + 151)/2 = 146]. The blue line in the chart below shows the 1-period SMA for SPY. The Read More