MailBag March 29, 2013 at 08:57 AM

StockCharts.com subscribers can view their ChartLists in many different formats. These include Summary, 10 Per Page, ChartBook, Gallery, MarketCarpet and CandleGlance. Today we will look at the stocks in the Dow Industrials using the Summary and CandleGlance modes. First, start out with a SharpChart in your desired ChartList. The example below shows IBM in the "Stocks-Dow Industrials" ChartList. Next, click "view all" to see 10 per page. The view all mode opens the door to the various viewing options. At the top of the page, chartists can use the drop down list to Read More
MailBag March 22, 2013 at 09:24 AM
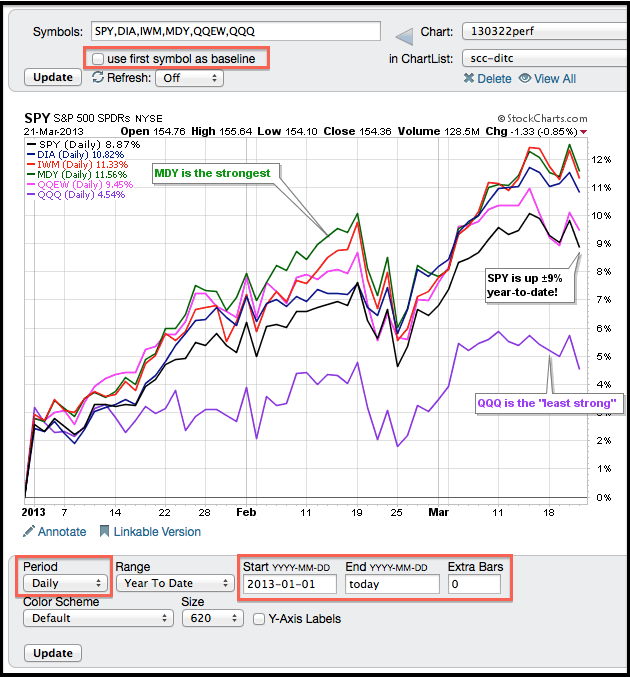
Chartists can create a performance chart using the “create a chart” box at the top of every web page. Simply enter up to six symbols separated by a comma in the symbol entry box. Leave the selection on SharpChart and click go. This will create a SharpChart showing the performance for these six symbols. The example below shows the performance for six major index ETFs since January 1st (year-to-date). *LINEBR** In addition to annotating this chart, the red boxes highlight three unique features. First, chartists can check the box to make the first symbol the Read More
MailBag March 15, 2013 at 11:34 AM
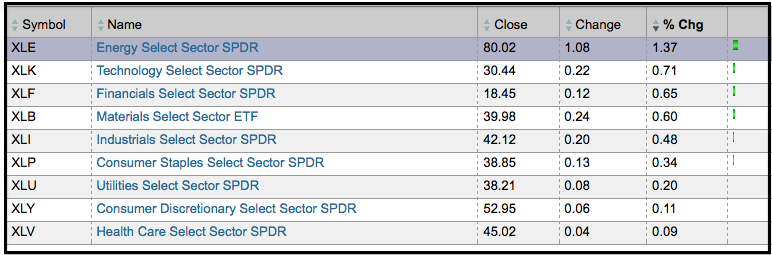
The Sector Summary gives chartists the ability to view sectors, the industry groups within the sectors and the stocks within these industry groups. Starting with the sectors, each section is shown as a sortable table. The first image shows the Energy SPDR (XLE) leading the way on March 14th. Users can click on the Energy Select Sector SPDR name to see the industry groups that make up the sector. Click this image for a live table The second image shows the five industry groups within the energy sector. It is sorted by percentage change by default Read More
MailBag March 08, 2013 at 09:58 AM
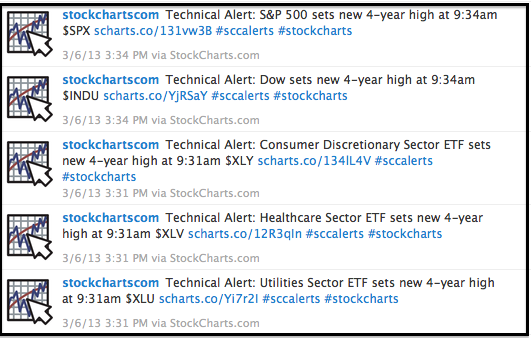
StockCharts.com offers a number of pre-defined technical alerts that chartists can follow on our website or on twitter. Follow @stockchartscom to receive tweets when predefined alerts trigger. These tweets will have the hashtag #sccalert as well. The image below shows what these tweets look like. Users can also follow our alerts on the technical alerts summary page. These can be viewed in summary view or timeline view. The color-coding on the summary page makes it easy to distinguish between bullish and bearish alerts. Each alert is linked to a SharpChart that Read More