Step-by-Step September 30, 2012 at 09:02 PM
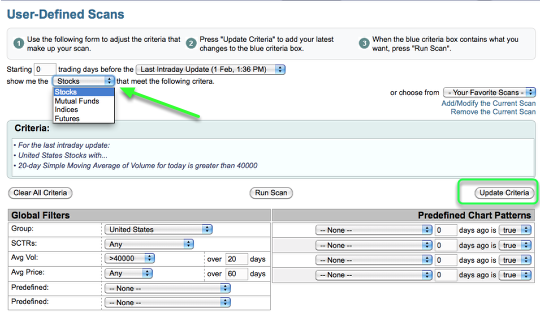
Did you know you can select to scan for just Mutual Funds, Indices or Futures? This step by step tutorial explains how to do just that. Below you will find the steps provided for both the Standard or Advanced Scan Interface depending on which one you use. Standard Scan Interface To scan for either Mutual Funds, Indices or Futures go to the Standard Scan Interface and above the "Criteria" box click the drop-down that by default says "Stocks". You can select from the drop-down either Read More
Step-by-Step September 30, 2012 at 01:38 PM
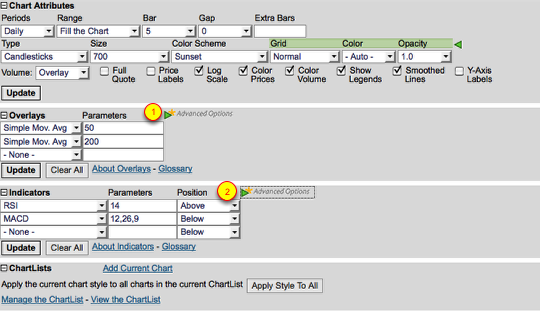
With our Basic and Extra memberships we provide the "advanced options" for Overlays and Indicators. The advanced options provide you with additional features to select from when creating your SharpCharts. Below you will find the steps on how to access "Advanced Options". Access Advanced Options To expand the "advanced options" for both Overlays and Indicators please click on the "green triangle" that says "advanced options". Advanced Read More
Step-by-Step September 29, 2012 at 11:02 PM
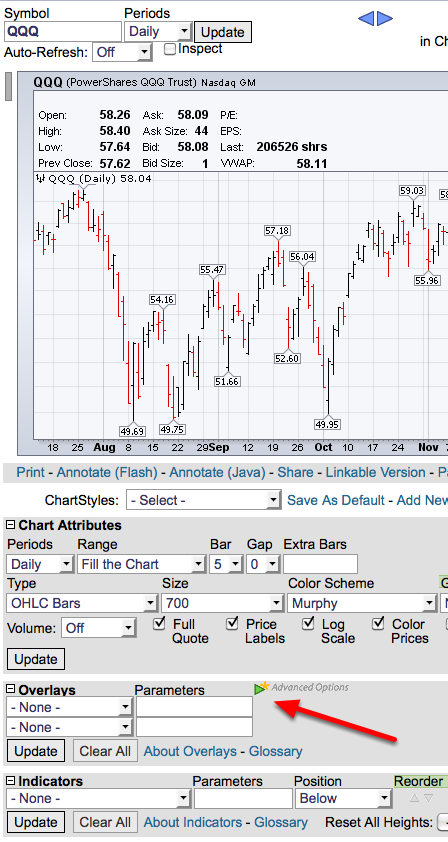
Shading the area between Bollinger Bands provides a different look and some people may prefer that to the default lines. This tutorial shows how you can create shaded bands. Expand the "Advanced Options" for Overlays in the SharpCharts Workbench Click on the green arrow on the right side of the "Overlays" section to expand. Skip to the next step if this is already done. Add Bollinger Bands to the Chart and Select Your Options Read More
Step-by-Step September 29, 2012 at 09:10 PM
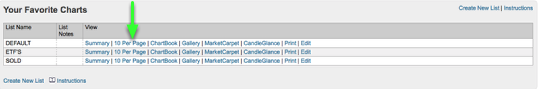
The ability to quickly review and update saved charts is a great benefit that StockCharts provides. The steps below explain how to review and update your saved charts. 10 Per Page View The best way to quickly view full size versions of your charts for review is to use the "10 per page view". This view displays up to 10 charts on a single page for you to review. To access this view click "10 Per Page" located to the right of the list of charts you wish to view. If you are a Basic member you can access this view by Read More
Step-by-Step September 29, 2012 at 06:45 PM
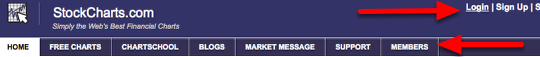
Now that you've created an account with StockCharts, it's time to login and start charting. It is important that your browser is configured to accept all of our cookies or you will not be able to login successfully. You can find information on verifying if your cookie settings are correct here. Click on the Login link or Members Tab To start the login, click on the "Login" link in the upper right corner of our homepage or, click on the Read More
Step-by-Step September 29, 2012 at 02:00 PM
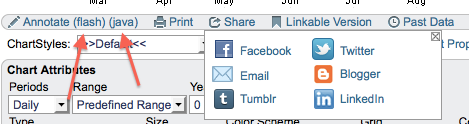
Using ChartNotes, our annotation tool, you can add trendlines, text, arrows and much more to any chart. This tutorial shows you how to add Fibonacci Retracements. Click "Annotate(Flash)" Link Below the SharpChart Create the SharpChart for which you want to add Fibonacci Retracements to. Make sure the chart is exactly what you want to use before starting ChartNotes! Once you start annotating a chart, you cannot change the time period. After creating a SharpChart Read More
Step-by-Step September 28, 2012 at 07:05 PM
You can now chart "-$VIX" to see an inverted chart of the VIX. In fact, you can add a minus sign to the front of any ticker symbol to chart the true inverse of that dataset. For example: CLICK HERE Read More
Step-by-Step September 28, 2012 at 07:02 PM
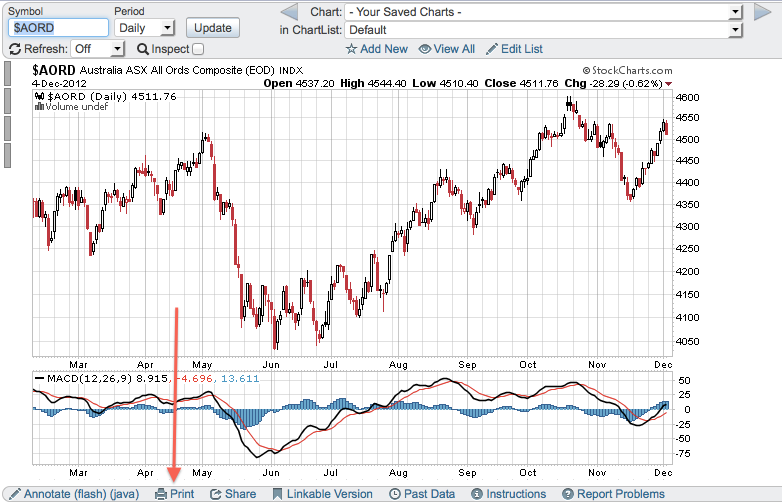
We've added a special "Print" feature to our SharpCharts Workbench that allows you to print out just your chart without all of the extra buttons, banners and icons that you see on the workbench itself. We recommend that people do not use the "File / Print" menu command in their web browser but instead use the method described below to print out our charts. Click on the "Print" link directly below the chart Select print options and print Read More