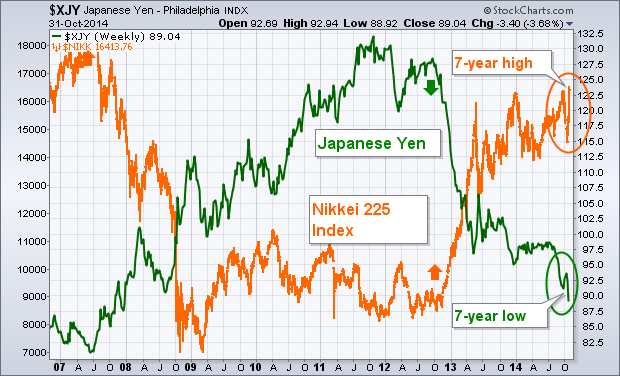
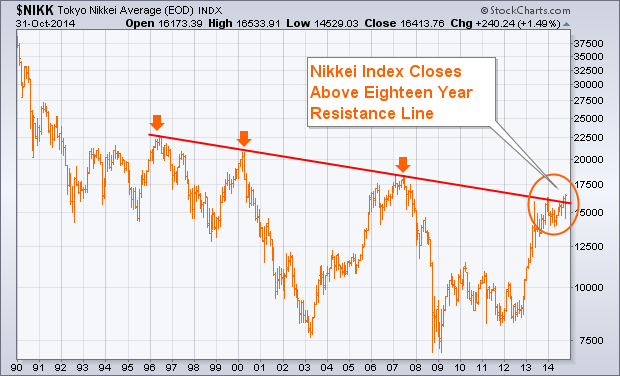
Japanese authorities surprised everyone on Friday by increasing their already aggressive bond purchases (QE) by a third. In addition, it will expand those purchases to include stocks and real estate investments. The Japanese pension fund also announced that it will increase its allocation to domestic and foreign stocks. That gave a huge boost to global stocks. The most dramatic effect was seen in Japan. Chart 1 shows the Japanese yen tumbling to the lowest level in seven years. At the same time, the Nikkei Index surged nearly 5% to the highest level in seven years. We've pointed out many times before that the falling yen since the end of 2012 has been the main driving force behind Japanese stock gains. That was certainly the case again this week. The monthly bars in Chart 2 show the Nikkei also climbing above a major resistance line drawn over its 1996, 2000, 2007 highs. That upside breakout suggests that Japanese stocks may finally be emerging from their role as one of the world's weakest stock markets. Since the start of 2013, the Nikkei has risen 57% versus a 28% gain in the Vanguard All World Stock Index (and a 41% gain in the S&P 500). Japan is trying to emerge from nearly two decades of deflation. The latest Japanese inflation figure of 1% is only half of the target rate of 2%. It still has a ways to go.
Not every index and not every sector recorded a new high this week, but several key indexes recorded new highs and the majority of sectors hit new highs. This shows broad market strength that validates the long-term uptrend in stocks. The only negative is that stocks are short-term overbought after big moves. This negative, however, is actually a positive because it takes strong buying pressure to become overbought. On a closing basis, the Dow Industrials, the S&P 500, the Nasdaq 100 and the Dow Transports recorded new 52-week highs this week. The S&P Small-Cap 600 and the S&P MidCap 400 remain below their 52-week highs, but both indices surged over 10% with very strong moves. At this point, the majority of the major indices hit new highs and this is long-term bullish.

The offensive sectors also performed well with the Finance SPDR (XLF), Technology SPDR (XLK) and Industrials SPDR (XLI) hitting 52-week highs on a closing basis. The Consumer Discretionary SPDR (XLY), which is the fourth offensive sector, is less than 2% below its 52-week high. Also note that the HealthCare SPDR (XLV), Consumer Staples SPDR (XLP) and Utilities SPDR (XLU) hit new highs this week. That means six of the nine sectors hit 52-week highs this week. The majority of sectors are clearly in long-term uptrends and this also supports a long-term uptrend for stocks in general.

Good trading and good weekend!
Arthur Hill CMT
The continued desire of central banks to stimulate the economy seems to be onto its next round.
With the Halloween announcement of the Japanese Pension Fund spending $247 Billion on equities worldwide and at least 1/2 of that on foreign equities, it would appear a new buyer is showing up for work. While this is not the central bank directly, the central bank announced more bond buying, which happens to match the Pension fund wanting to unload about $250 billion. By selling to the Bank of Japan, the pension fund has found a way to move the bonds out of their portfolio. If we were to follow the trend of "Show Me The Money" the Japanese have just announced a massive catalyst. This additional capital, which is equivalent to 3 months of the QE3 US stimulus, may provide another opportunity to continue to the bullish ascent.
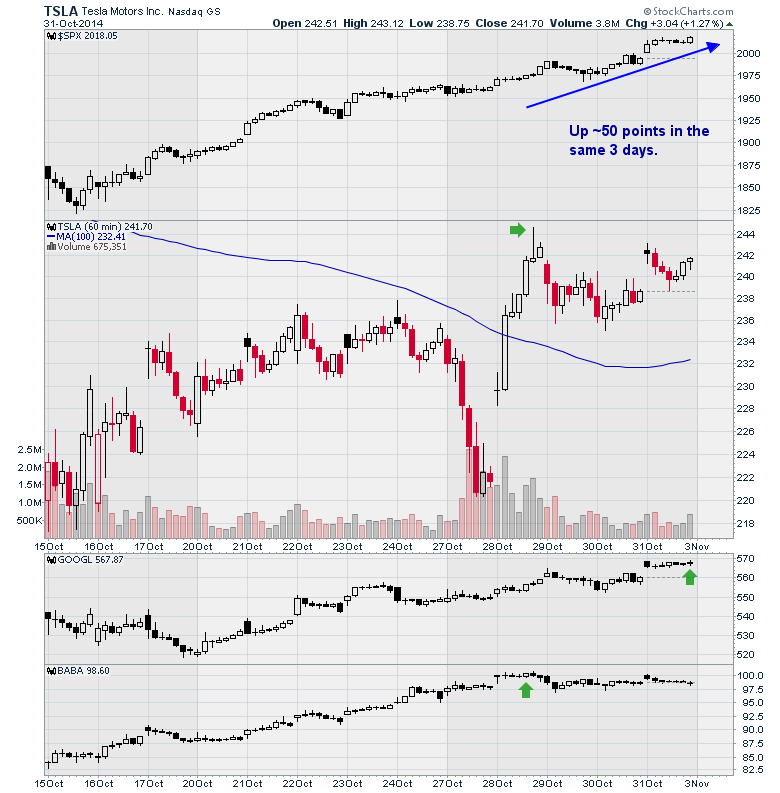
With the $COMPQ volume on Friday only slightly above the 50 DMA average, I am suspect of the $SPX/Nasdaq highs. We'll continue to watch next week as some high beta name stocks did not trade well this week. Stocks like Facebook (FB), Alibaba (BABA), Tesla(TSLA) and Gilead (GILD) have not followed the market higher over the last 3 days, leading me to be cautious of the high fliers. While even great stocks don't rise every day, you would expect them to run when the overall market is up a full 3 percentage points. With MSFT returning in strength and AAPL hitting new highs, the charts of Microsoft and Apple are very similar to the chart of the $SPX. However, Facebook made highs on Tuesday morning, gapped down after blowout earnings and a poor conference call, then built a doji on Friday. Gilead (GILD) had a good candle on Friday's last hour or it would have closed the week without enjoying any of the ripping rally. It did make a high Friday morning on the open, but sold off most of the day in an up day market. The volume on Gilead was 25% higher for the week with little more than a doji candle to show for it. The Nasdaq was up 1.4% on Friday alone.
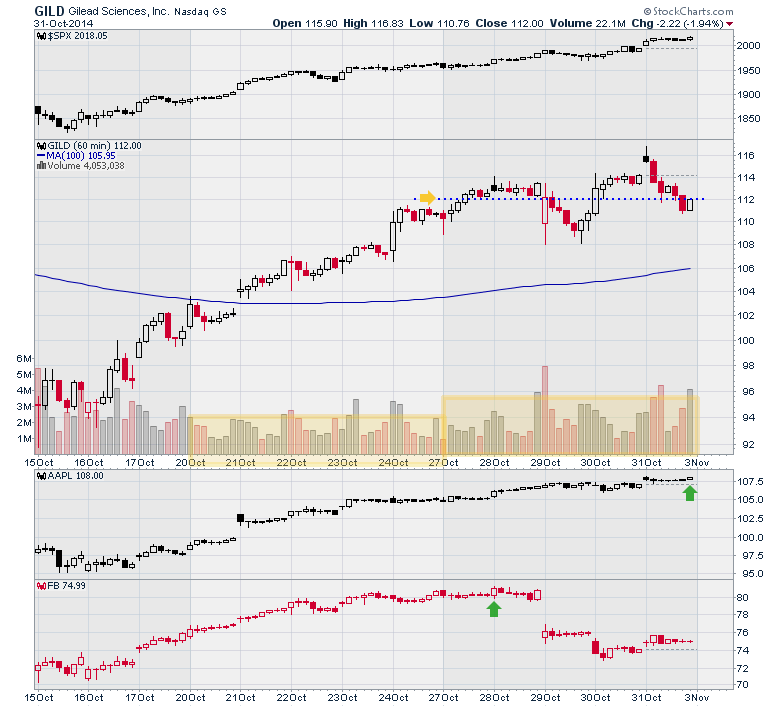
TSLA made highs on Tuesday with FB and BABA. Tesla closed near the high of the week. BABA reports on Monday. GOOGL tracked the $SPX all week. Just interesting how many of the high fliers made highs on Tuesday with Wednesday, Thursday and Friday so bullish for the indexes.
There might be more opportunity in the Japan Hedged ETF (DXJ) with the announcement or the Hedged European ETF (DBEU) if more stimulus is coming from Mario Draghi and the ECB. It will be important to hedge the currency because the Yen and the Euro have not been doing well.
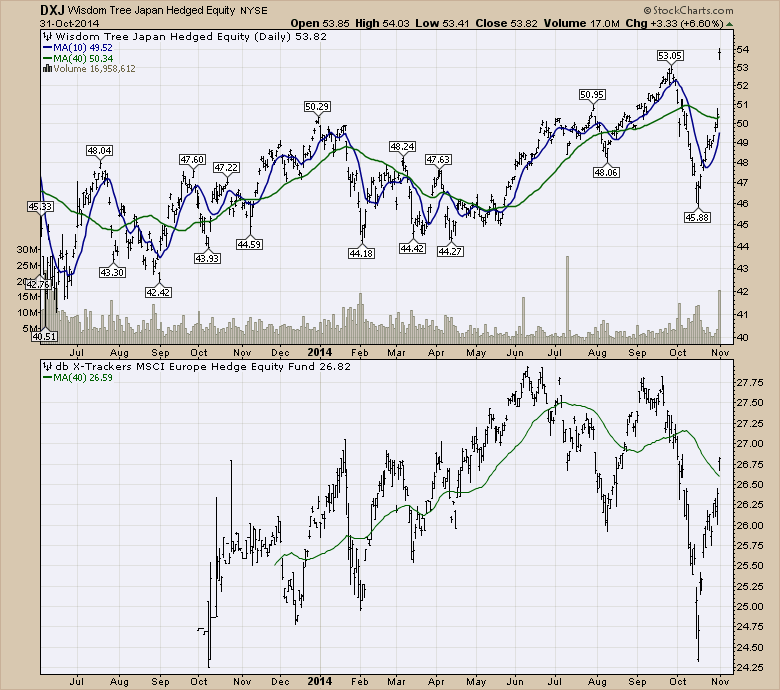
In summary, follow the money. It appears to be coming to Japan (DXJ) and the EU next.The EU ETF (DBEU) only has 300,000 - 500,000 shares a day trade. I would watch Gilead (GILD) closely. It may have a better week next week, but this week was not as strong as I would have expected. With only 42% of the Nasdaq Composite above the 200 DMA that seems weak after 2 weeks of going vertical. Almost 75% of the $SPX is back above the 200 DMA so that is much better. The Nasdaq 100 has 78% bulls. They would be in the $SPX list too. I sport very mixed emotions on the rally leadership.
Good trading,
Greg Schnell, CMT
We have been watching gold for a possible triple bottom, a base for the next strong rally. Earlier this month gold bounced off an important support line, offering hope to gold bulls that the third bottom in the series would be successful. However, the price of gold has slipped badly in the last two weeks, and on Friday the triple bottom support line failed to hold.
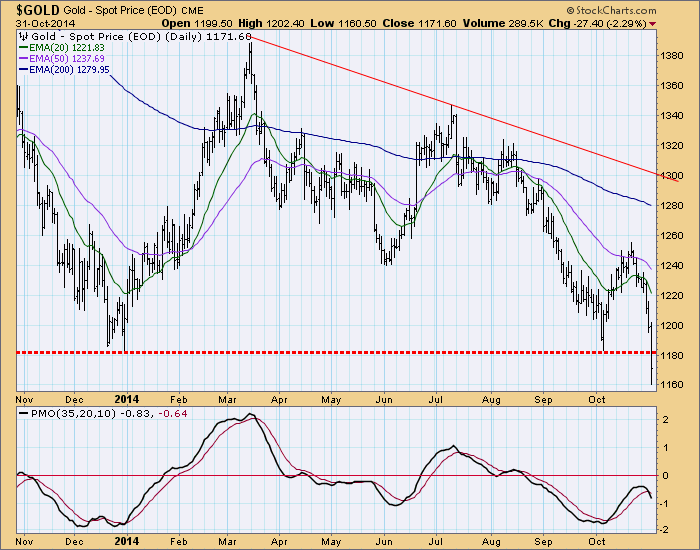
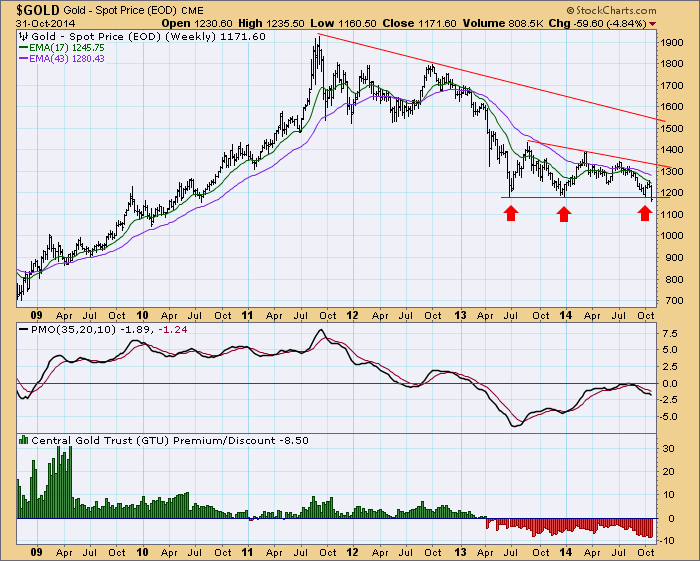
The weekly chart shows the big picture. While the triple bottom looked tempting, the consolidation of the last year was a negative continuation pattern, meaning that it would most likely resolve downward as the decline from the 2011 top resumed. The declining tops marking the top of the formation was also a negative sign. Finally, the persistent discount* on shares of Central Gold Trust (GTU) displayed on the bottom panel showed that sentiment on gold never got out of the basement.
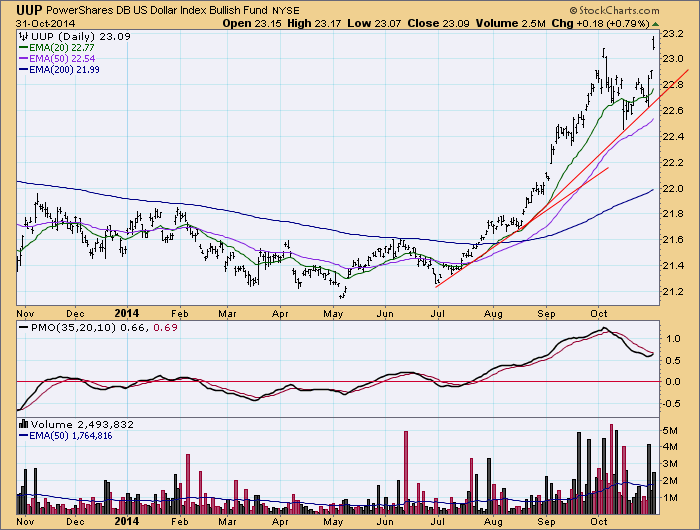
The main factor in gold's problems is the strength shown by the U.S. dollar since midyear. While it consolidated gains in the first half of October, it jumped to new highs on Friday.
Conclusion: While we anticipated that gold's decline might end with a triple bottom, that possibility seems remote with Friday's breakdown. The breakdown will not be decisive until price drops to about 1145, but it now seems unlikely that gold will begin a new bull market any time soon.
* GTU is a closed-end fund that owns gold. Unlike open-end funds, GTU shares can trade at a premium or discount to net asset value. The amount of premium/discount gives us a good indication of sentiment regarding gold.
First, let me say Happy Halloween to all! It's an exciting time for many, but especially the children. I know our neighborhood is always buzzing with kids anticipating the sugarfest! :-)
Unfortunately, the stock market bears were SPOOKED on Halloween this year. I've said for months the biggest problem with shorting all the warning signs I've been seeing throughout 2014 are the central bankers. We've seen it all too often here in the U.S. - just when it appears there's been irreparable technical damage inflicted on stocks, the Fed steps in with another round of QE or dovish announcements. On Friday, it was Japan's turn as the Bank of Japan announced an increase in its asset purchase program. That lifted stocks around the globe and begged the question, "Is this a Trick or Treat?"
Well, no one knows for sure, but I do not pay attention to the headline news that reminds us the key benchmark indices - Dow Jones and S&P 500 - are hitting all-time highs. Don't misunderstand me, it is significant because it's lifting portfolios everywhere and we're all investing to make money. But it's more important to me to gauge the risk that I'm taking in order to achieve those nice returns. Investing heavily while knowing there are signs of an impending major correction or bear market right around the corner is not prudent.
So is this the renewed vigor of a runaway bull market or should we be cashing in our chips? Let's take a look beneath the surface of this latest rally and then you decide how much risk you're willing to take.
It's important to realize that this latest all-time high on the Dow Jones and S&P 500 comes with 4 out of 9 sectors breaking out recently to year-to-date highs. 3 of those 4 sectors are defensive sectors - healthcare, consumer staples and utilities. Only industrials have made the breakout among the aggressive sectors with financials and technology on the cusp of doing so. If we break it down even further, here are the percentages of industry groups within each sector that have broken out:
NEUTRAL SECTORS:
Energy: 16%
Materials: 20%
AGGRESSIVE SECTORS:
Technology: 9%
Financials: 33% (excluding the defensive REITs, this would be 21%)
Industrials: 38%
Consumer Discretionary: 22%
DEFENSIVE SECTORS:
Healthcare: 80%
Consumer Staples: 40%
Utilities: 80%
To summarize, 60% of the industry groups in defensive sectors have supported the breakout in our major indices, while just 25% of industry groups in aggressive sectors have gone along for the ride. That's a significant variation that certainly suggests traders are hedging their bets and not fully believing in this rally. And while treasury prices have finally started falling, sending the 10 year treasury yield ($TNX) back above 2.30% and its 20 day EMA, treasuries have been heavily purchased throughout 2014 as our major equity indices have begrudgingly pushed to fresh highs.
This just doesn't pass the smell test to me, but we can't ignore the "candy store" remaining open at central bankers everywhere. This is unprecedented and really makes technical analysis more challenging currently. Technical analysis does require the study of history and historical prices and the Fed's (and all central bankers) QE measures have not been a part of history - at least not to the extent we're seeing it now.
There are industry groups that look particularly attractive, but before I get to those, let's take a look at one positive development technically. The weekly MACD on the S&P 500 has been signaling slowing momentum throughout 2014. The weakness we saw in October actually has helped to alleviate that technical issue moving forward. Check out this chart:
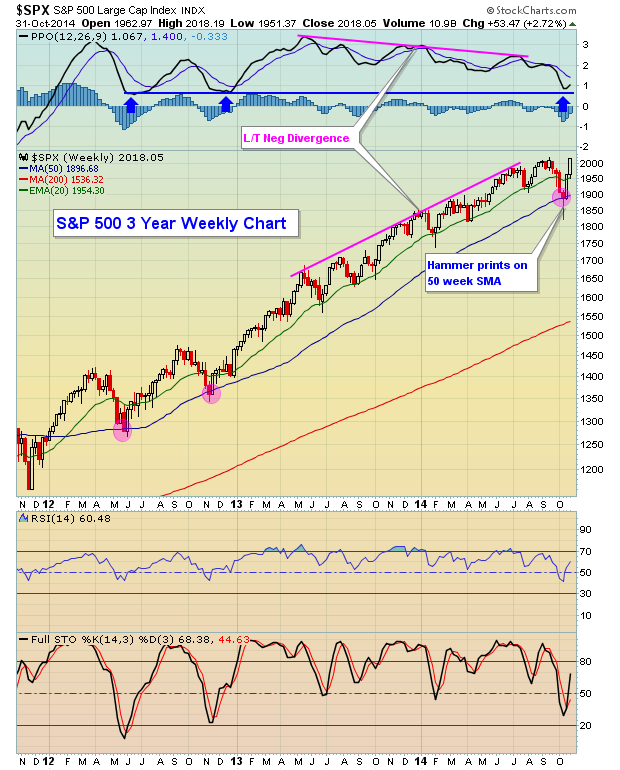
So I consider this at least one red flag erased. There are plenty more to go though, including the lagging Russell 2000. While its larger counterparts are breaking out, this small cap and much more aggressive index remains roughly 3.5% from a breakout.
We want to see leadership from aggressive areas of the market. Despite all the Fed's great intentions, many traders simply haven't bought into all the hype that the Fed has resuscitated our economy and it will perform well on its own as we move forward. There's also the concern of how the Fed reverses its bloated balance sheet. But I'll leave that for another day.
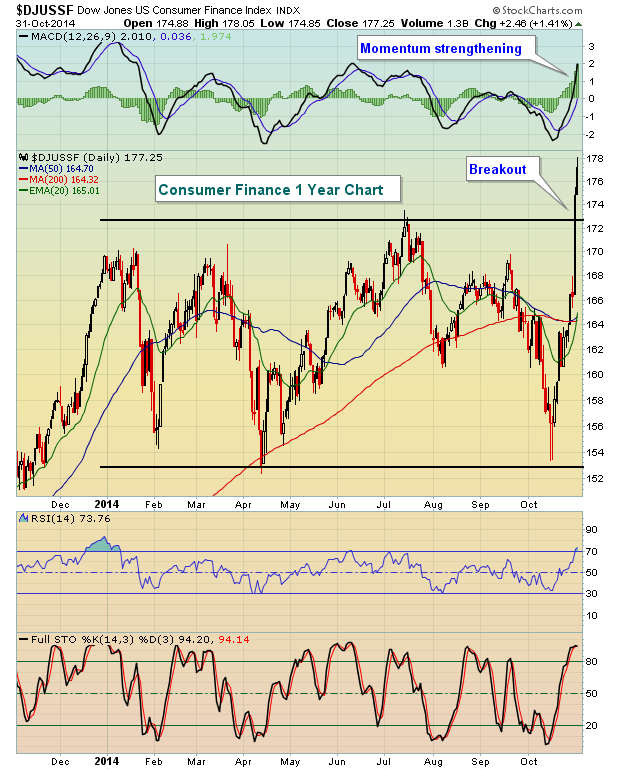
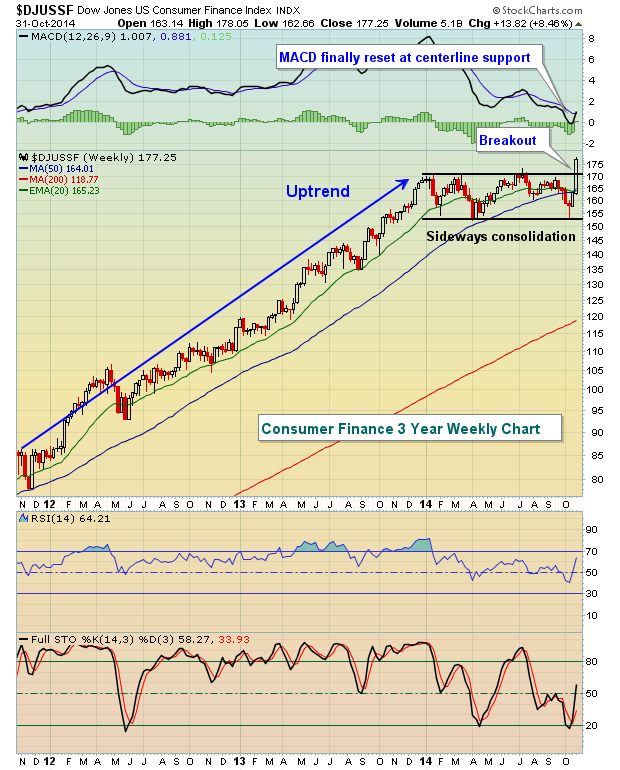
Today, let's talk about a key aggressive industry group that is leading the recent action. Consumer Finance ($DJUSSF). We finally saw a breakout last week after a long basing period in this group that can be seen on both the daily and weekly charts below:
I am now offering a FREE chart of the day every day the stock market is open. It will be highly educational and also present possible trading opportunities. Monday's chart of the day features perhaps the best stock within that consumer finance space. CLICK HERE to register.
Happy trading!
Tom Bowley
Chief Market Strategist
Invested Central


 Google "money management" and you'll get back a quagmire of non-sequiturs, disjointed, inconsistent and incomplete information. There is no single comprehensive definition. There isn't even any number of consistently similar definitions. Yet what do most Market Wizards disclose as one of the keys to their success: money management. Frustrated by this sad state of affairs...