Art's Charts September 29, 2010 at 10:23 AM
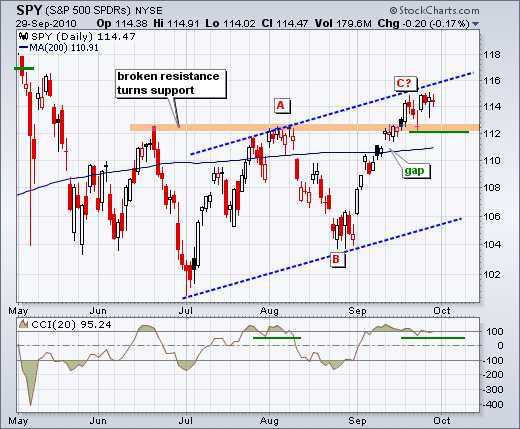
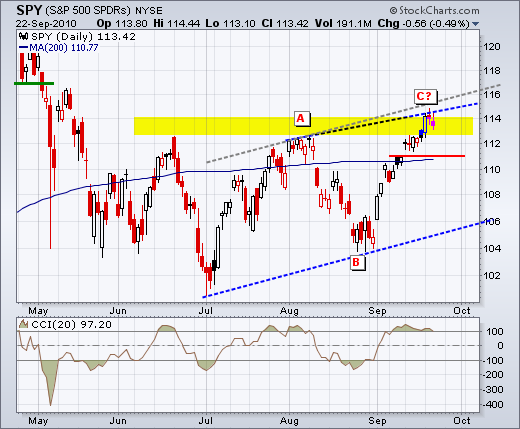
There is no change on the daily chart. SPY continues to stall around 114 and has yet to break support. Even though the trend is clearly up here, I am leaving the ABC correction possibility on the chart. SPY is also near channel resistance and overbought... Read More
Art's Charts September 29, 2010 at 10:19 AM
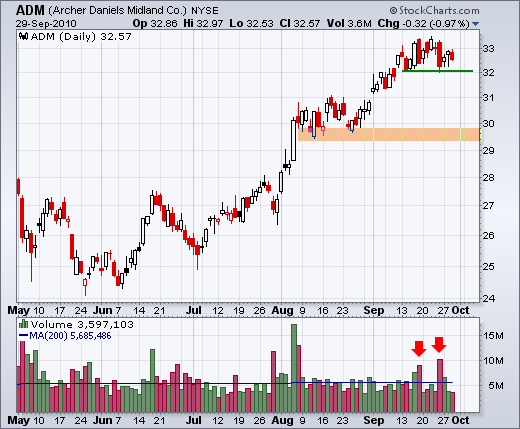
Charts of Interest: ADM, AN, ASEI, CME, FITB, HCBK, HSY, LSI, PLCM --------------------------------------------------------------------------------------------------------------------- This commentary and charts-of-interest are designed to stimulate thinking... Read More
Art's Charts September 28, 2010 at 12:22 PM
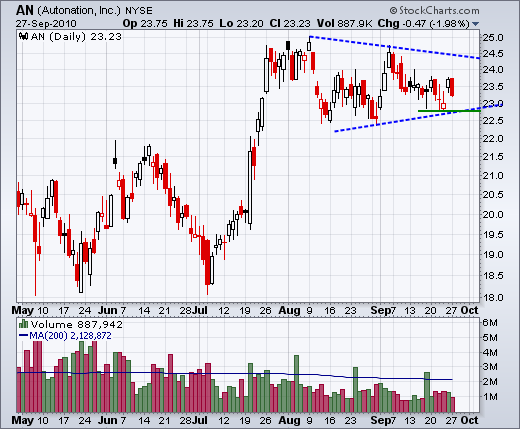
Charts of Interest: AN, CLF, FDX, NAT, RTN, SHAW, THC This commentary and charts-of-interest are designed to stimulate thinking. This analysis is not a recommendation to buy, sell, hold or sell short any security (stock ETF or otherwise)... Read More
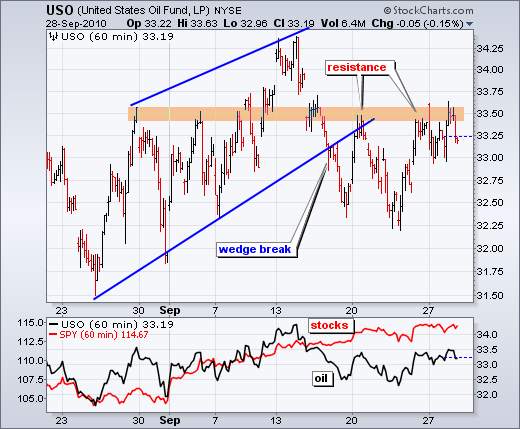
Art's Charts September 28, 2010 at 12:18 PM
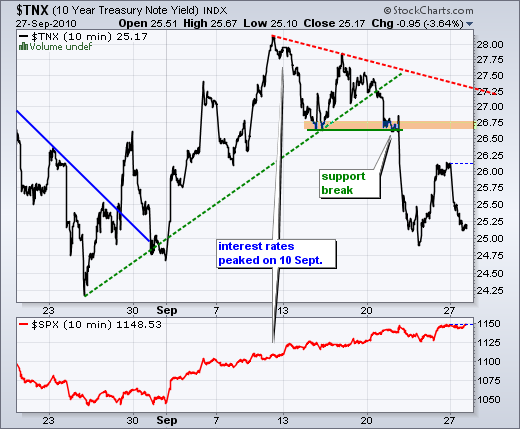
The risk-on trade remains in force, but the bullish case has been weakening since last week. Even though the Euro remains in clear uptrend, supporting the risk-on trade, the 10-year Treasury Yield ($TNX) remains in a downtrend and fell further on Monday... Read More
Art's Charts September 28, 2010 at 05:50 AM
Once again, stocks dipped on Monday and early Tuesday, but quickly recovered with a sharp rally that held up into the close. The medium-term and short-term trends are clearly up, but the intermarket picture remains mixed... Read More
Art's Charts September 26, 2010 at 01:04 AM
After a relatively short pullback the prior three days, stocks rebounded with a strong move on Friday. The major indices were all up 2% or more with the Russell 2000 leading the charge (+3.42%). Relative strength in small-caps is a big positive for the market... Read More
Art's Charts September 24, 2010 at 12:30 PM
Thursday's action was not encouraging. Stocks started weak as the major index ETFs gapped down on the open. However, the bulls came in almost immediately and pushed stocks into positive territory just after 11AM. Techs led the rebound... Read More
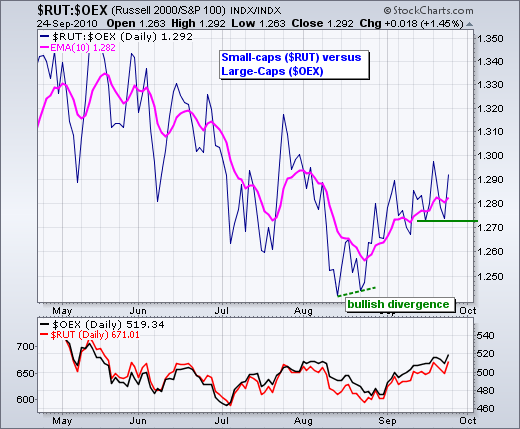
Art's Charts September 24, 2010 at 12:01 PM
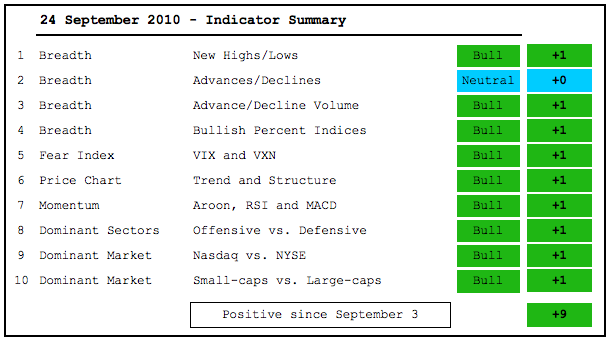
Despite a few discrepancies, the indicator summary remains in the bullish camp. The Russell 2000 ETF (IWM) has yet to break its summer highs, but QQQQ, SPY and DIA have broken through... Read More
Art's Charts September 23, 2010 at 08:50 AM
On the daily chart, SPY formed red indecisive candlesticks with a stall around 114 the last two days. These spinning tops can sometimes foreshadow reversals. Judging from the candlesticks, a decline below 112 would erase Monday's gain and call for a short-term trend reversal... Read More
Art's Charts September 21, 2010 at 12:37 PM
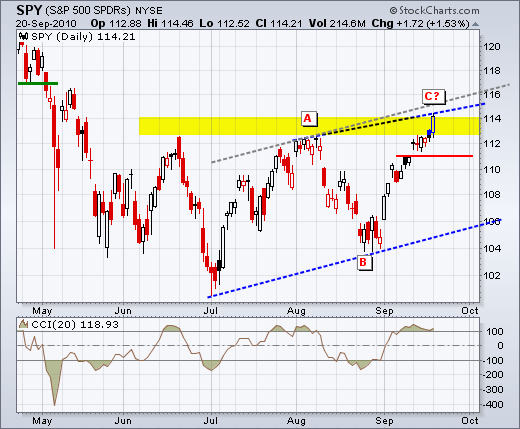
SPY broke above its summer highs and closed at its highest level since the second week of May. Perhaps the advance is accelerating higher with this breakout. At this point, the bulls are in clear control and I am focused on what it would take to turn this chart bearish... Read More
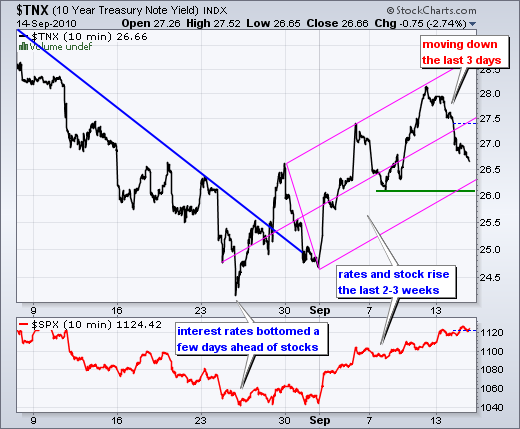
Art's Charts September 21, 2010 at 06:48 AM
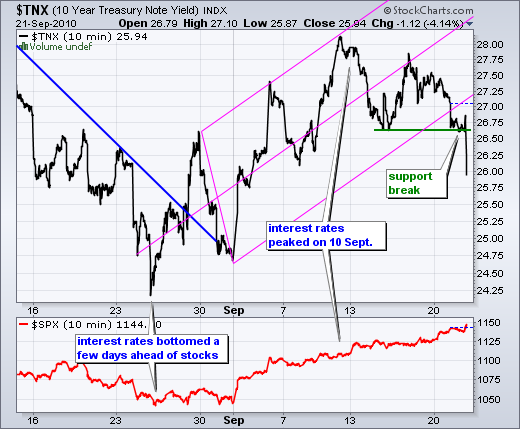
For stocks, there was good news and bad news on Tuesday. It is positive to see the Euro surging, but negative to see interest rates falling. Throughout 2010, stocks have been positively correlated with interest rates and negatively correlated with the Euro... Read More
Art's Charts September 19, 2010 at 11:28 AM
There is not much change on the daily chart as we head towards the Fed policy statement on Tuesday. Even though no major policy changes are expected, we cannot not rule volatility on Tuesday afternoon... Read More
Art's Charts September 17, 2010 at 06:25 AM
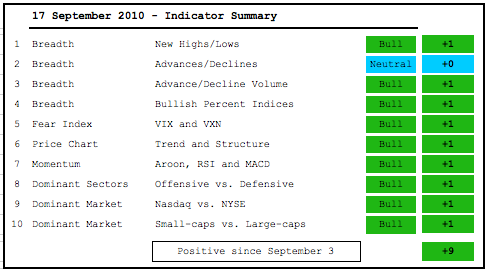
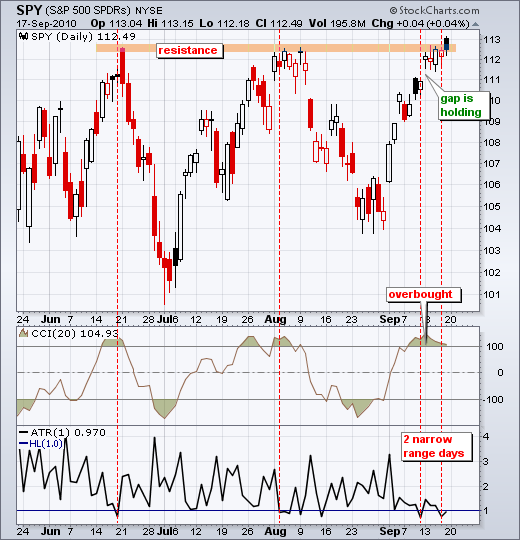
With a couple more indicator turns, the indicator summary is now within a point of its maximum reading, which is +10. This often happens after an extended advance and the S&P 500 ($SPX) is up significantly in September... Read More
Art's Charts September 17, 2010 at 05:24 AM
Trading is getting a bit strange, but the bulls clearly have the edge in the stock market right now. Techs have started to lead on the upside, but small-caps were relatively weak as IWM closed down on Thursday... Read More
Art's Charts September 16, 2010 at 04:32 AM
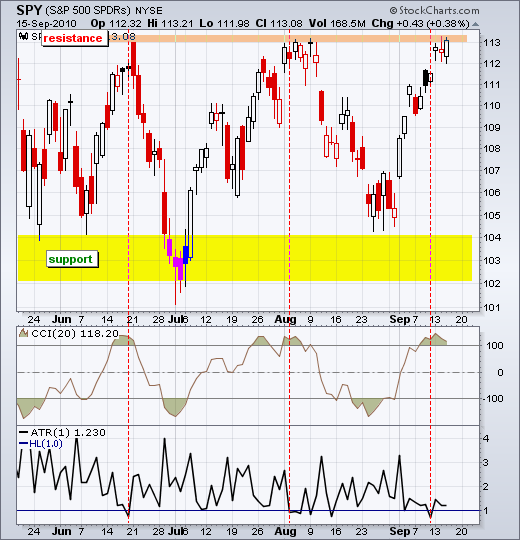
After a weak open, buyers came into the market and pushed stocks higher with a little pop coming in the final hour. There seems to be some performance anxiety creeping into the market as the major indices trade well above their August lows... Read More
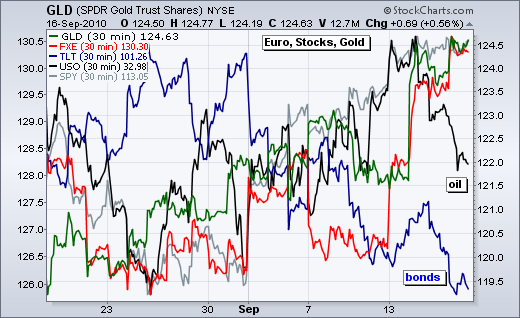
Art's Charts September 15, 2010 at 01:37 AM
There were a couple of bullish developments in the intermarket area over the last few weeks. First, bonds have been moving down and interest rates higher since late August. Bonds have been negatively correlated with stocks in 2010. Interest rates have been positively correlated... Read More
Art's Charts September 14, 2010 at 05:29 AM
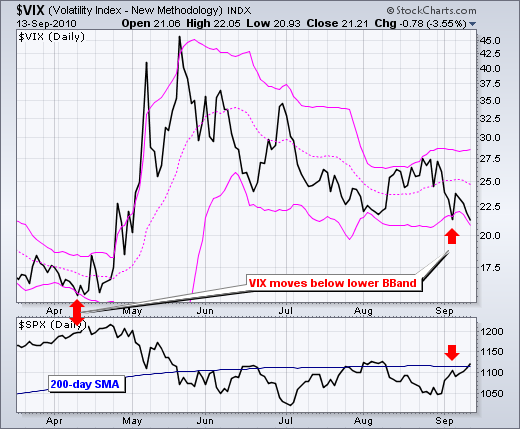
The S&P 500 Volatility Index ($VIX) reached an extreme five days ago that could foreshadow a pullback or top in the stock market. The chart below shows the VIX with Bollinger Bands... Read More
Art's Charts September 13, 2010 at 04:31 AM
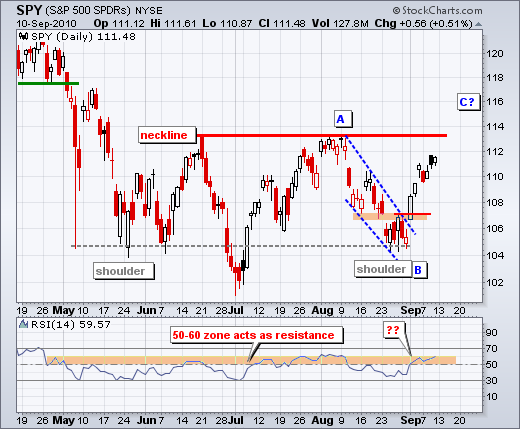
On the daily chart, SPY remains within a large consolidation with support around 104 and resistance around 113. The ETF closed at 111.48 and the futures are pointing to a little upside pop on the open... Read More
Art's Charts September 10, 2010 at 06:47 AM
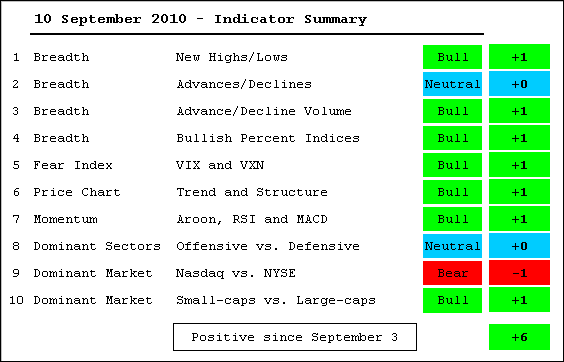
The indicator summary has been switching from positive to negative since May. This coincides with a trading range in the S&P 500 since May. This week the Bullish Percent Indices and Volatility Indices flipped into bull mode... Read More
Art's Charts September 10, 2010 at 02:59 AM
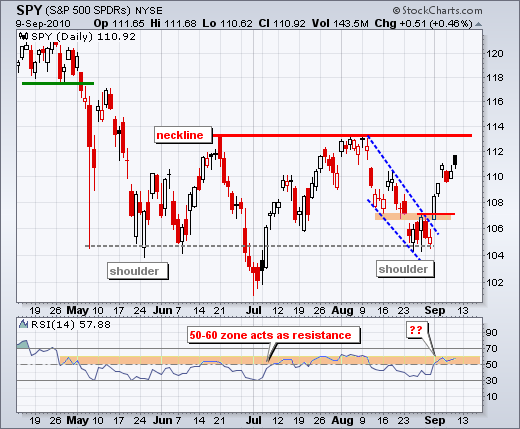
There is no real change on the daily chart as SPY labors higher. The ETF fell back with a red candlestick on Tuesday, edged higher with a small white candlestick on Wednesday and then formed a filled black candlestick yesterday. Black means the close was up from the prior close... Read More
Art's Charts September 09, 2010 at 04:44 AM
For short-term traders, SPY is currently caught between a rock and a hard place. The swing is clearly up after last week's breakout, but the ETF became overbought with Friday's close above 111... Read More
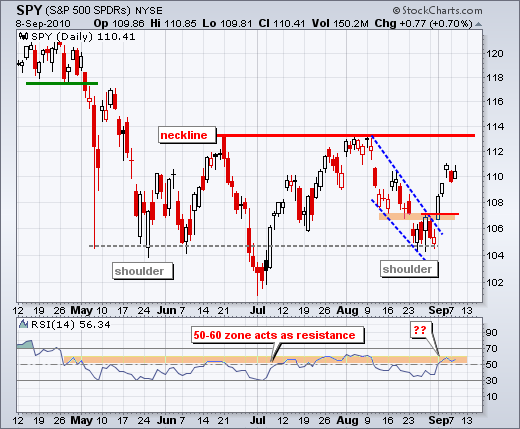
Art's Charts September 08, 2010 at 03:07 AM
On the daily chart, the S&P 500 ETF (SPY) is currently on an upswing within a larger consolidation. This larger consolidation is, of course, the inverse head-and-shoulders pattern. Unconfirmed, this pattern is just one big consolidation or trading range... Read More
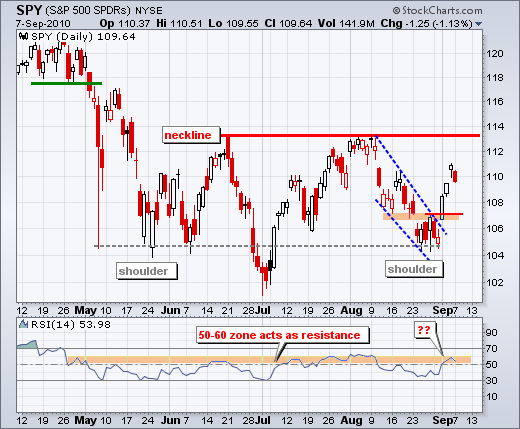
Art's Charts September 07, 2010 at 05:15 AM

Last week's breakout and extended surge reversed the August downtrend. Also note that SPY formed a higher low in late August. With strong breadth and strong follow through on Thursday and Friday, this breakout looks like the start of an extended advance... Read More
Art's Charts September 03, 2010 at 05:20 AM
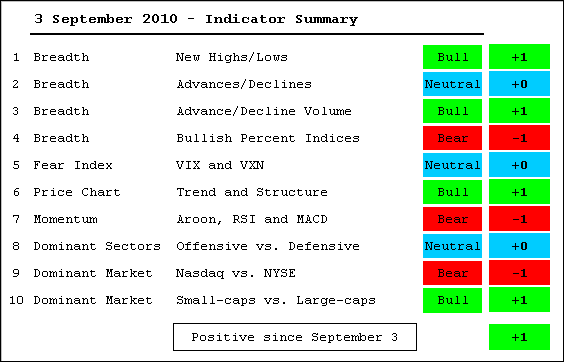
Big swings continue to whipsaw the indicator summary. The S&P 500 first closed below 1100 on May 20th. Since then the index has crossed the 1100 level at least nine times as the index trades within a large consolidation... Read More
Art's Charts September 03, 2010 at 04:18 AM
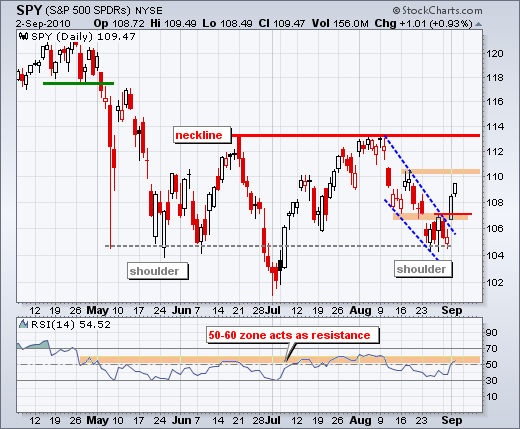
There is not much change on the daily chart. SPY held above its July low and found support near the May-June lows. With a channel breakout, the ETF forged a reaction low and the inverse head-and-shoulders becomes a possibility... Read More
Art's Charts September 02, 2010 at 05:51 AM
Stocks around the world surged on Wednesday with many stock indices breaking out of their August downtrends. In the US, small-caps led the way higher with the Russell 2000 surging 3.81%. The Nasdaq and S&P 500 were both up around 3%... Read More
Art's Charts September 01, 2010 at 03:30 AM
The overall trend for most short-term indicators remains down and important resistance levels were established with Monday's decline. As with the major index ETFs, I will be watching the Friday-Monday highs for a breakout and trend reversal... Read More