Art's Charts January 31, 2011 at 04:41 AM
After grinding higher for several weeks to keep the uptrend in place, stocks turned sharply lower on Friday and the bulk of the short-term evidence is now bearish... Read More
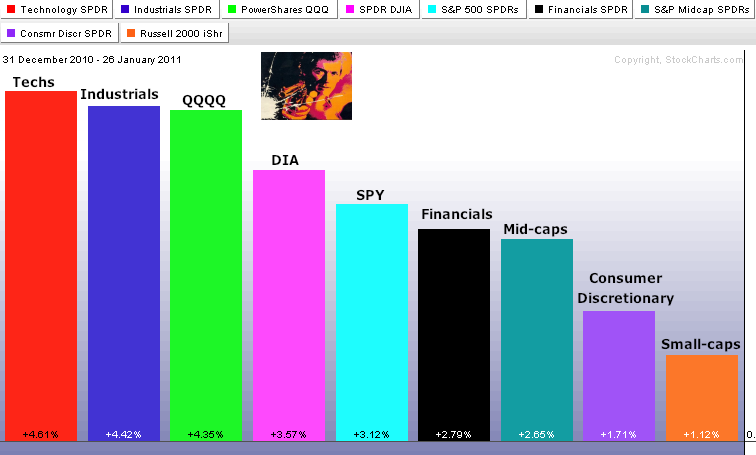
Art's Charts January 28, 2011 at 05:02 AM
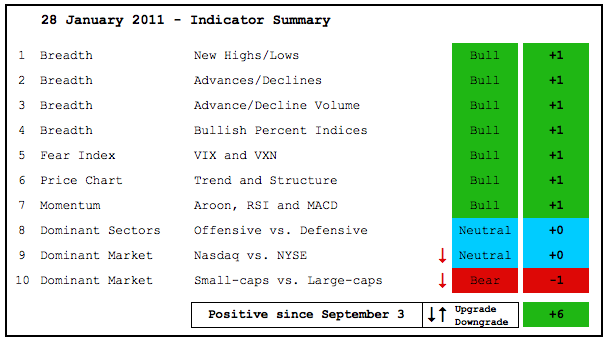
The indicator summary remains positive, but cracks in the bullish case are starting to appear. It all started with relative weakness in small-caps and the consumer discretionary sector, two important areas of the market... Read More
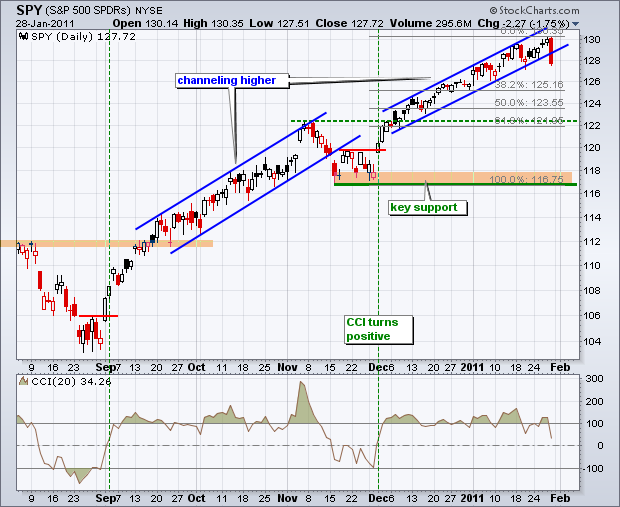
Art's Charts January 28, 2011 at 03:47 AM
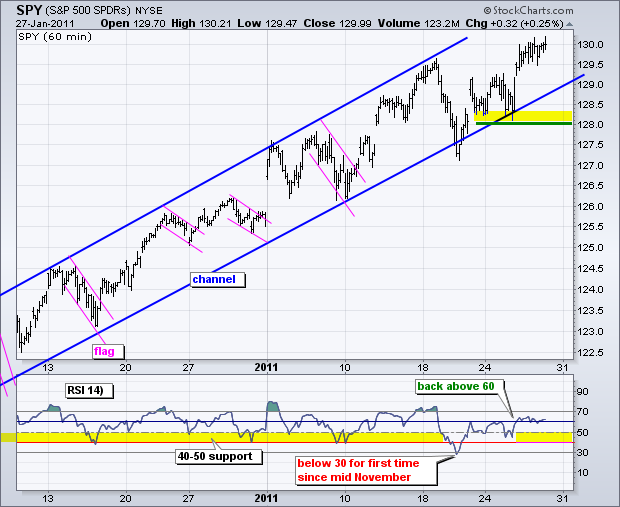
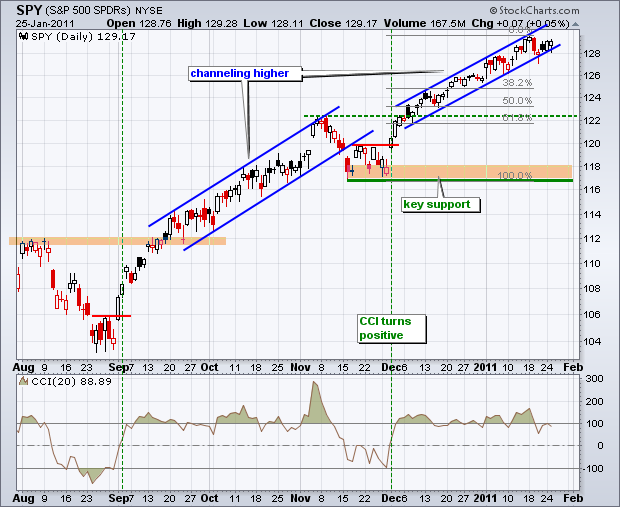
There is no change in the short-term trend or key indicators. Price-wise, the SPY trend is up as the ETF holds its rising price channel. Key support on the 60-minute chart remains at 128... Read More
Art's Charts January 27, 2011 at 05:54 AM
It is certainly tempting to pick a top and turn bearish now, but such thoughts bring me back to a quote from Dirty Harry... Read More
Art's Charts January 27, 2011 at 05:37 AM
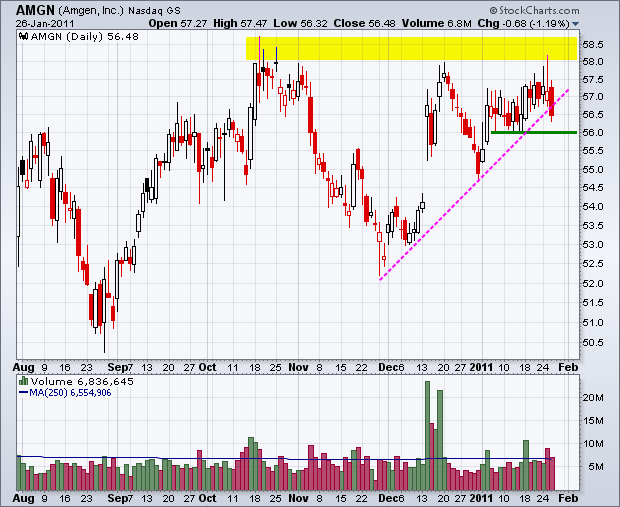
Don't forget that it is earnings season! AMGN falls after shooting star. BOOM forms bull flag. GMS hits resistance at gap. Plus FLO, LEAP, LOGI and WDC. This commentary and charts-of-interest are designed to stimulate thinking... Read More
Art's Charts January 26, 2011 at 05:42 AM
Stocks have traded flat the last few days, but the fireworks could start soon. The State of the Union address is out of the way with no major surprises and the Fed makes its policy statement today... Read More
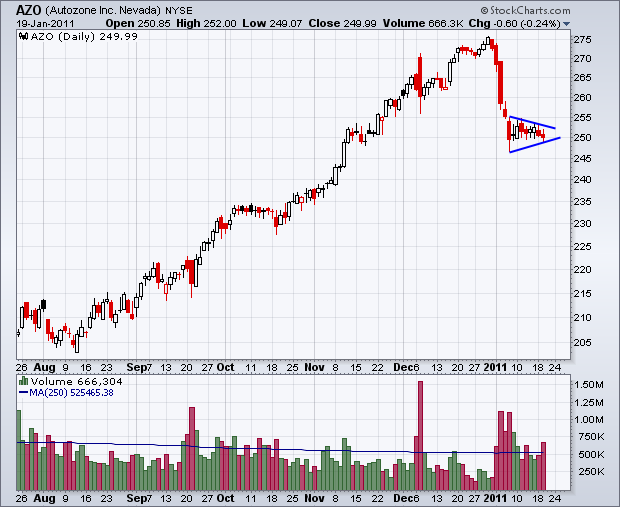
Art's Charts January 25, 2011 at 04:18 AM
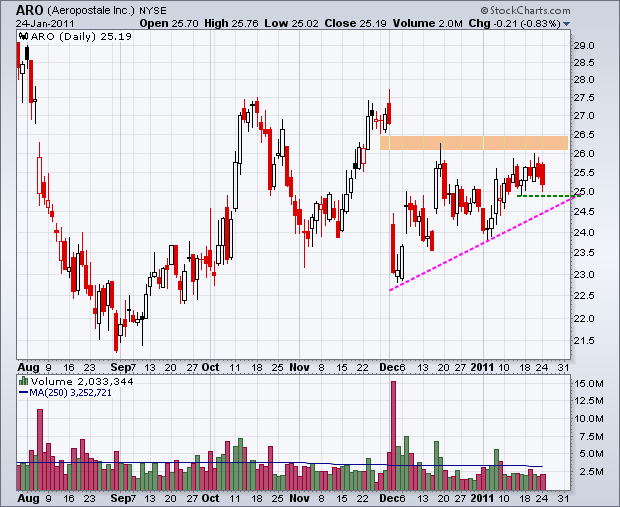
It's earnings season. Stocks reporting earnings are prone to higher volatility and risk. ARO backs off resistance, AZO forms tight consolidation. LLY firms on big volume. PFCM forms bear flag. This commentary and charts-of-interest are designed to stimulate thinking... Read More
Art's Charts January 25, 2011 at 03:46 AM
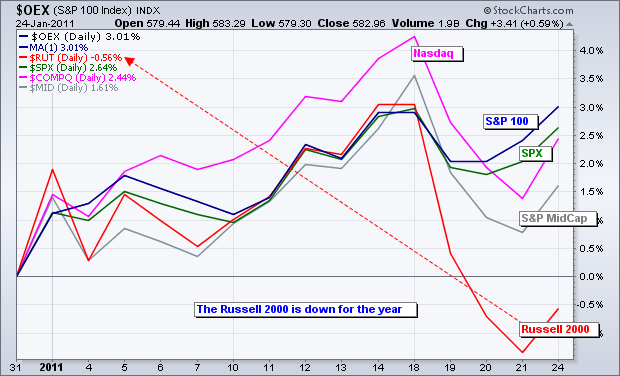
Stocks were broadly higher on Monday as the Dow Industrials zoomed to a new 52-week high. The Russell 2000, S&P 500 and Nasdaq 100 were also up on the day, but did not record new 52-week highs. The Dow is leading. The rest are lagging... Read More
Art's Charts January 24, 2011 at 04:39 AM
It is a pretty big week news-wise. First, earnings season is in full swing with over 350 reports slated for this week (and next). Second, the Fed starts its two day meeting on Tuesday with its policy statement expected at 2:15PM on Wednesday... Read More
Art's Charts January 21, 2011 at 11:20 AM
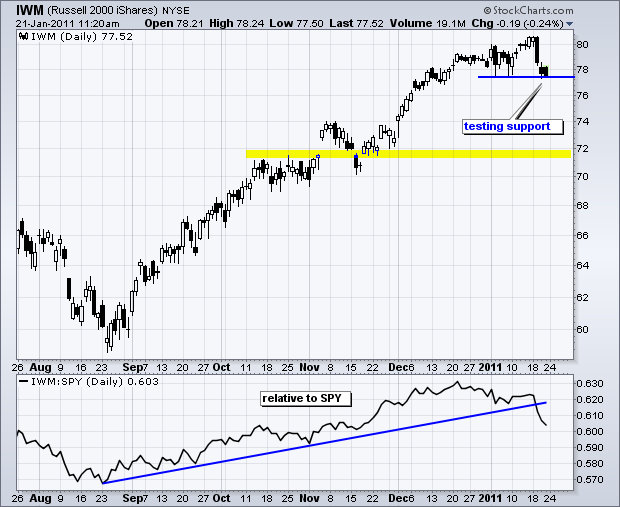
The Russell 2000 ETF (IWM) led the major index ETFs lower this week with a decline to its January lows. The ETF is testing support from these lows and showing relative weakness. Notice the Price Relative in the lower window... Read More
Art's Charts January 21, 2011 at 05:28 AM
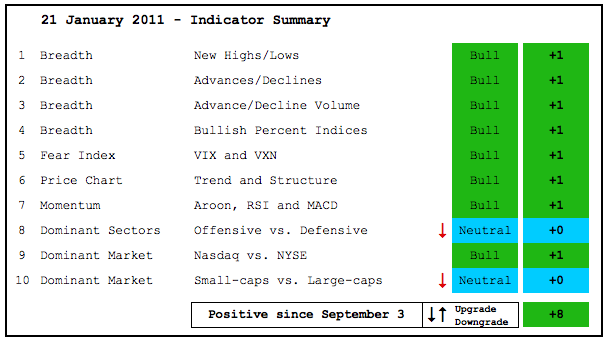
For the first time in many weeks, two indicator groups were downgraded in the indicator summary. Relative weakness in the Technology ETF (XLK) and Consumer Discretionary SPDR (XLY) caused me to downgrade offensive sector performance from bullish to neutral... Read More
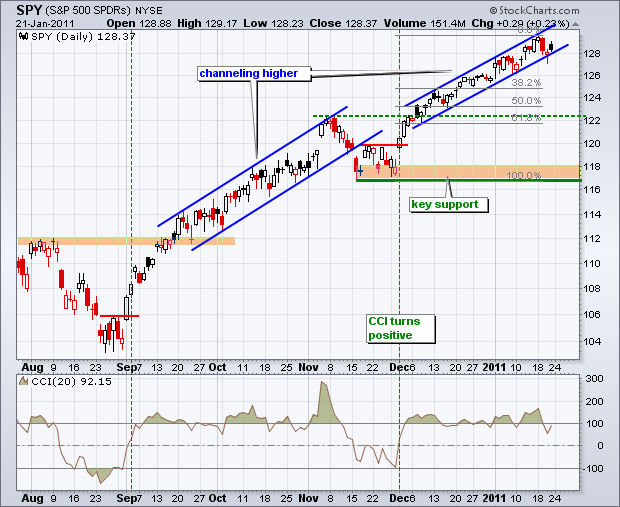
Art's Charts January 21, 2011 at 04:23 AM
On the daily chart, SPY dipped below the lower trendline of the rising channel, but bounced to close back above the trendline. This channel covers the short-term uptrend. The medium-term uptrend is defined by bigger events, namely the break above the November high... Read More
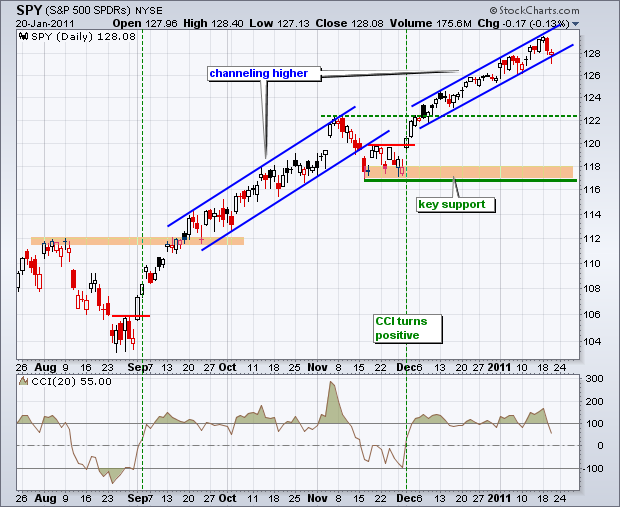
Art's Charts January 20, 2011 at 05:28 AM

Overall, SPY continues to move higher within a tight rising price channel. Obviously, this channel cannot hold forever. Wednesday's decline (-.98%) was the sharpest 1-day loss since late November, the 26th to be exact... Read More
Art's Charts January 20, 2011 at 05:24 AM
ECL bucks the trend with wedge breakout. KO forms bearish wedge. PNRA forms bearish pennant. Plus AZO, DRI, KMX, LLY, MHK and RHT. This commentary and charts-of-interest are designed to stimulate thinking... Read More
Art's Charts January 19, 2011 at 03:27 AM
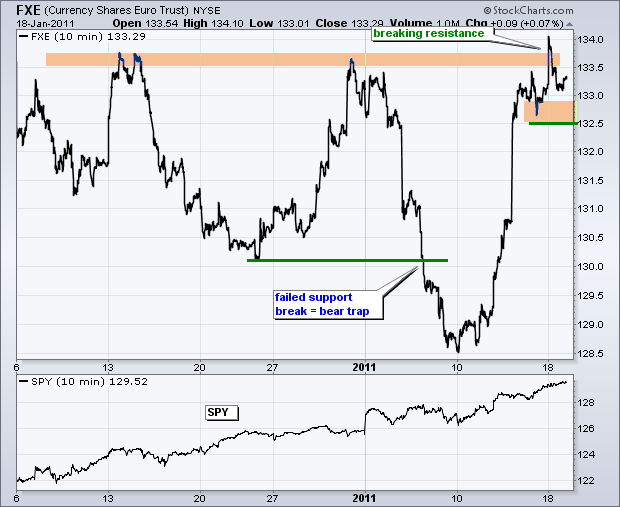
The intermarket arena continues to heat up as the Euro Currency Trust (FXE) breaks resistance and the Gold SPDR (GLD) forms a bull wedge... Read More
Art's Charts January 18, 2011 at 07:10 AM
There is no change in the stock market analysis. Both the medium-term (daily chart) and short-term (60-minute chart) trends are up with no signs of selling pressure... Read More
Art's Charts January 18, 2011 at 06:57 AM
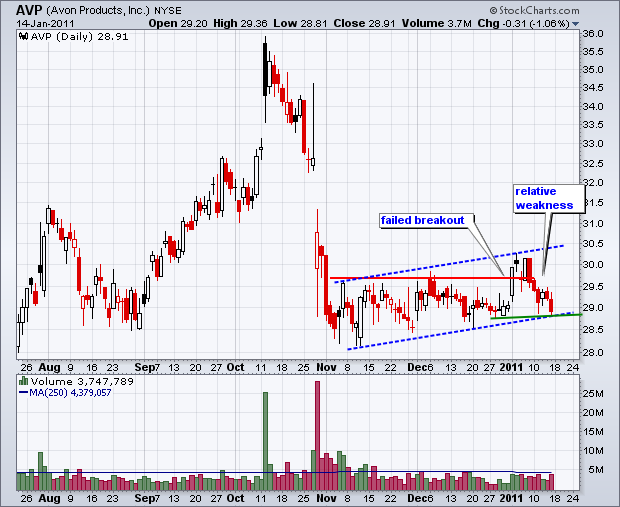
AVP fails to hold breakout. GERN forms small ascending triangle. YHOO extends consolidation. Plus ERTS, HRB, SUSS. This commentary and charts-of-interest are designed to stimulate thinking... Read More
Art's Charts January 14, 2011 at 05:08 AM
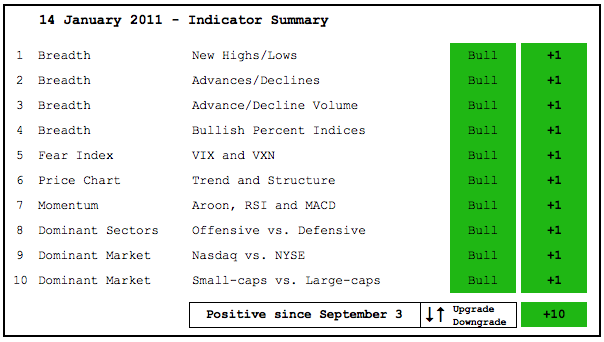
The stock market appears to be on bullish auto-pilot. In fact, it seems that a bit of complacency may be setting in... Read More
Art's Charts January 14, 2011 at 03:31 AM

Unsurprisingly, there is not change in the analysis of the daily or 60-minute charts. This December-January advance is looking awfully familiar. Looking back, we can see that SPY surged in early September, CCI became overbought and the ETF continued higher the next seven weeks... Read More
Art's Charts January 13, 2011 at 04:50 AM
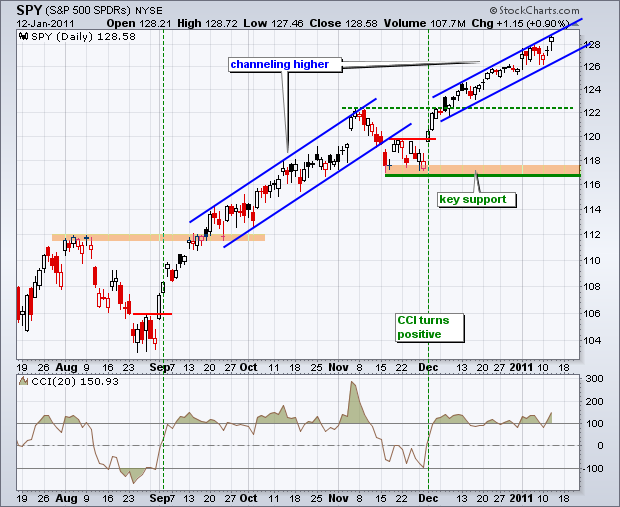
This December-January advance is looking awfully familiar. Looking back, we can see that SPY surged in early September, CCI became overbought and the ETF continued higher the next seven weeks... Read More
Art's Charts January 13, 2011 at 04:47 AM
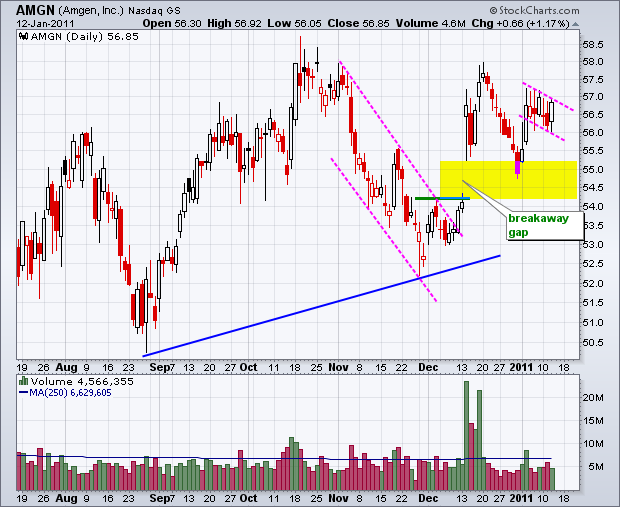
AMGN forms bull flag. BAX surges off support with good volume. ERTS firms within small wedge. Plus GILD, JWN, K. This commentary and charts-of-interest are designed to stimulate thinking... Read More
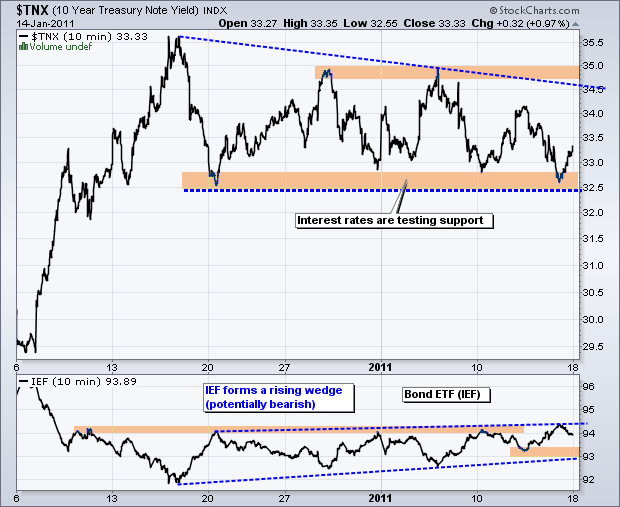
Art's Charts January 12, 2011 at 04:32 AM
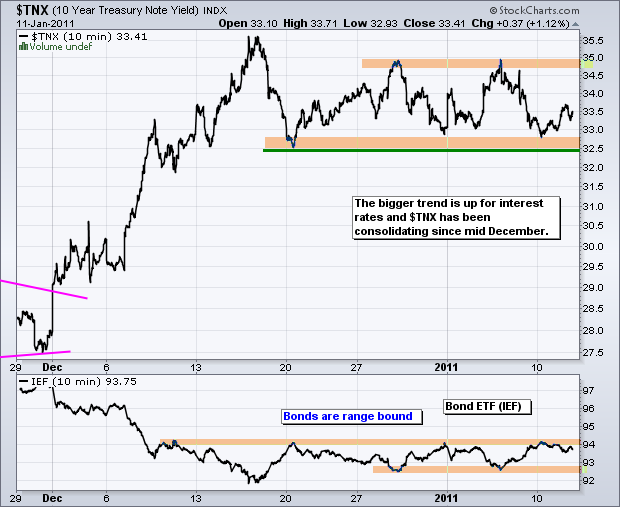
There is no change in the SPY trends so I will add coverage of the 10-year Treasury Yield ($TNX), Euro Currency Trust (FXE) and Gold SPDR (GLD) today. Interest rates remain in an uptrend overall and the 10-year Treasury Yield has been consolidating since mid December... Read More
Art's Charts January 11, 2011 at 05:05 AM
There is no change in the analysis for the medium-term (daily chart) or short-term (60-minute chart). SPY remains in a medium-term uptrend as the ETF recorded a new 52-week high last week. SPY started the week strong with an open above 126, but then stalled the rest of the week... Read More
Art's Charts January 11, 2011 at 05:03 AM
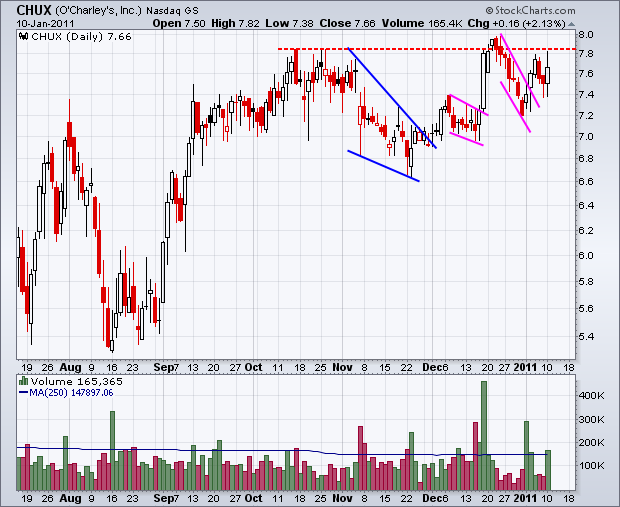
ISRG challenges resistance. MMM bounces with long white candle. NEM hits channel support. Plus CHUX, GERN, NEM, THO This commentary and charts-of-interest are designed to stimulate thinking... Read More
Art's Charts January 10, 2011 at 05:18 AM
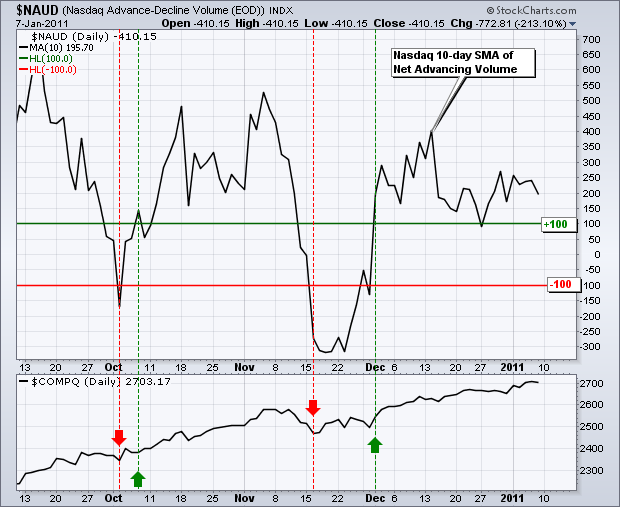
Short-term breadth indicators turned bullish in early December and remain bullish. These are the 10-day SMA for Net Advances and Net Advancing Volume for both the Nasdaq and NYSE. There are two breadth indicators for each major exchange... Read More
Art's Charts January 07, 2011 at 04:52 AM
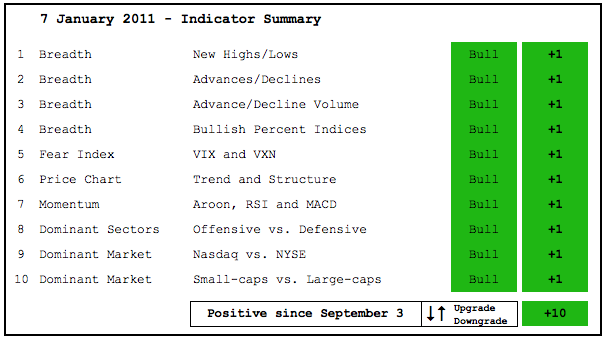
The stock market may be overbought and sentiment may seem excessively bullish, but there is simply no sign of weakness on the price charts or with the indicators. The AD Lines and AD Volume Lines both moved to new reaction highs this year... Read More
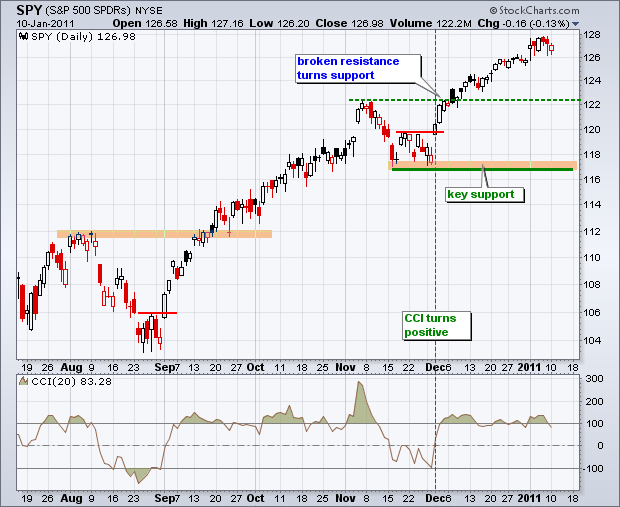
Art's Charts January 07, 2011 at 03:42 AM
There is no change in the short-term or medium-term analysis. Medium-term, the daily chart shows SPY in a clear uptrend with a new 52-week high this week. The ETF is up some 7.6% since December and up 22% since August. These big gains make the ETF overbought by most yardsticks... Read More
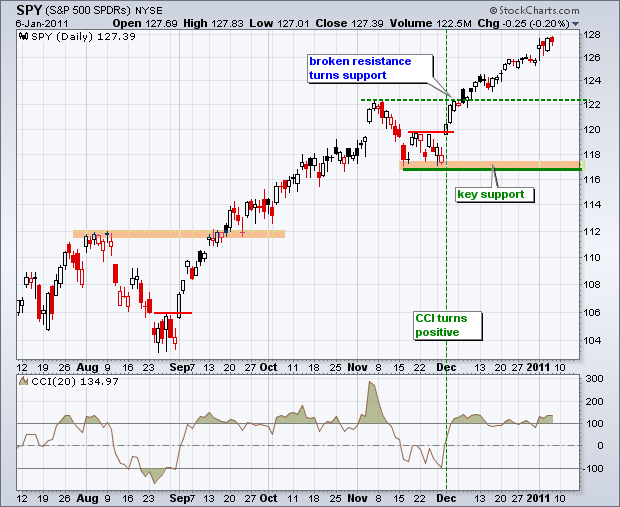
Art's Charts January 06, 2011 at 05:11 AM
There is no change in the short-term or medium-term analysis. Medium-term, the daily chart shows SPY in a clear uptrend with a new 52-week high this week. The ETF is up some 7.6% since December and up 22% since August. These big gains make the ETF overbought by most yardsticks... Read More
Art's Charts January 06, 2011 at 05:08 AM
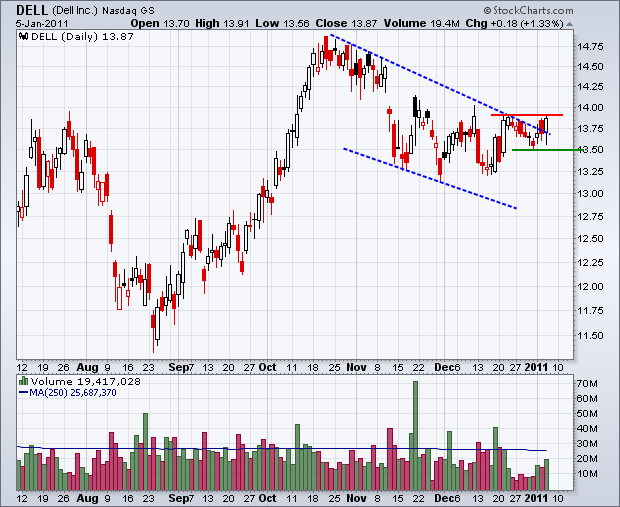
GILD gaps above trendline. HRB fills gap after selling climax. URBN hits support with falling wedge. Plus DELL,FDX,MAS,MRK,NE,YHOO This commentary and charts-of-interest are designed to stimulate thinking... Read More
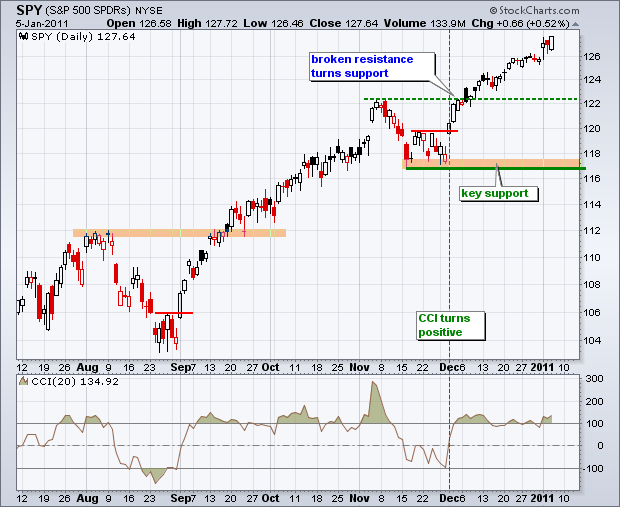
Art's Charts January 05, 2011 at 05:00 AM
There is not much change in the short-term or medium-term analysis. Medium-term, the daily chart shows SPY in a clear uptrend with a new 52-week high this week. The ETF is up some 7.6% since December and up 22% since August... Read More
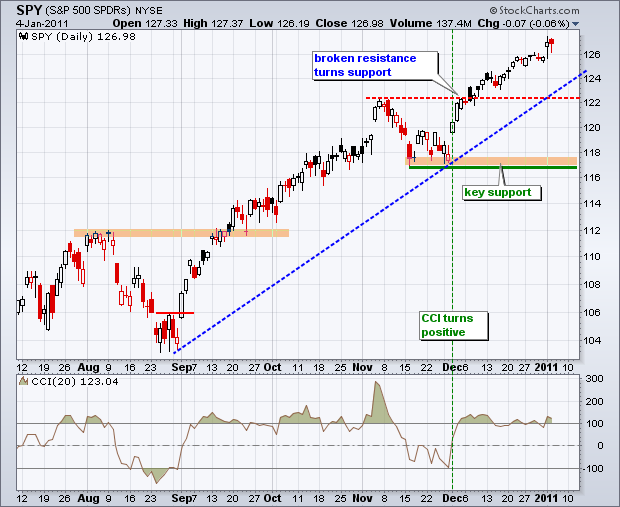
Art's Charts January 04, 2011 at 05:15 AM
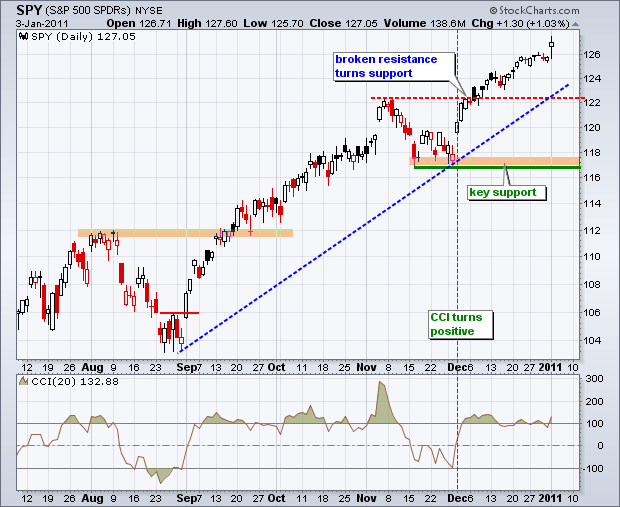
The bulls started January just like December as stocks surged on the open and remained at high levels throughout the day. The S&P 500 ETF (SPY) advanced just over 1% and recorded yet another 52-week high. SPY is now up 7.6% since the beginning of December... Read More
Art's Charts January 04, 2011 at 05:13 AM
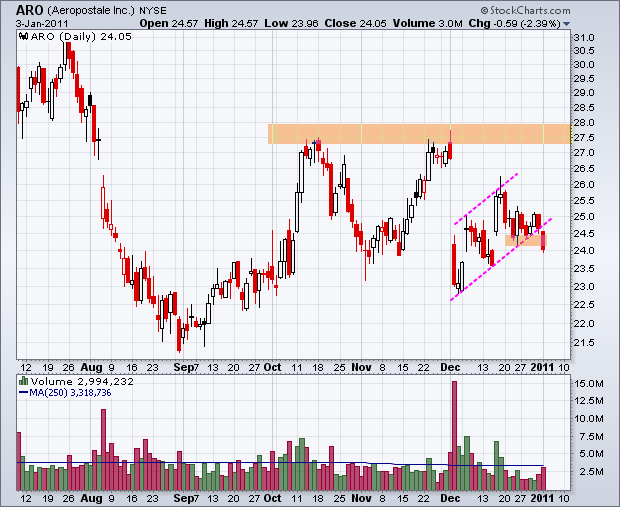
ARO breaks support. AVP surges above resistance. VRTX forms bullish pennant. Plus FXE,GCI,INTC,ISRG,$TNX. This commentary and charts-of-interest are designed to stimulate thinking... Read More
Art's Charts January 03, 2011 at 05:37 AM
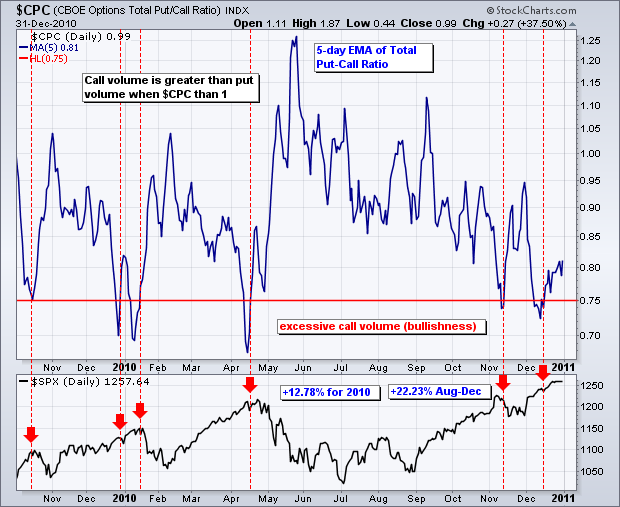
Even though sentiment is excessively bullish and stocks are ripe for a pullback, the major index ETFs simply show no signs of selling pressure and remain strong overall. The CBOE Total Put/Call Ratio ($CPC) dipped below ... Read More