Art's Charts November 30, 2011 at 04:59 AM
Guess what? Reports indicate that the Euro-zone bailout fund is smaller than EU finance ministers once thought. There is also a "secret" report suggesting that Italy is on the verge of blowing up the Euro zone. Yes, the rumors continue to fly... Read More
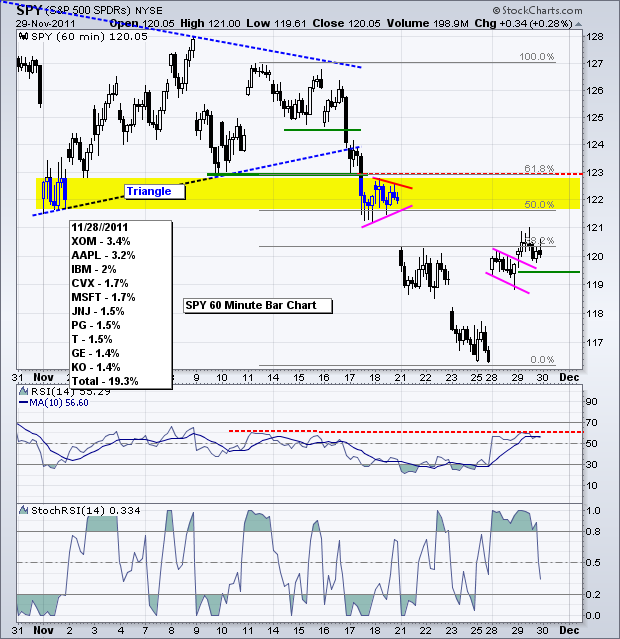
Art's Charts November 29, 2011 at 05:25 AM
Stocks opened strong and finished strong with a broad advance on Monday. While it is still considered an oversold bounce within a bigger downtrend, there is room for further upside before resistance from broken support levels comes into play... Read More
Art's Charts November 29, 2011 at 05:22 AM
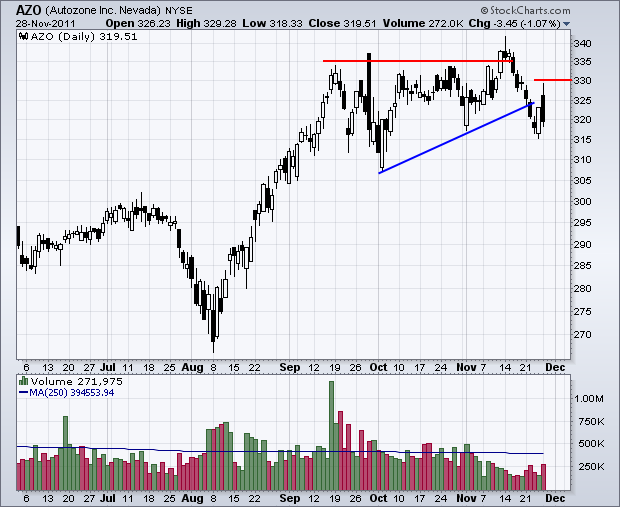
DDS Forms Pennant after Sharp Decline. LH Challenges Flag Resistance. SUN Gaps above Wedge Resistance. Plus AZO and TGT. This commentary and charts-of-interest are designed to stimulate thinking... Read More
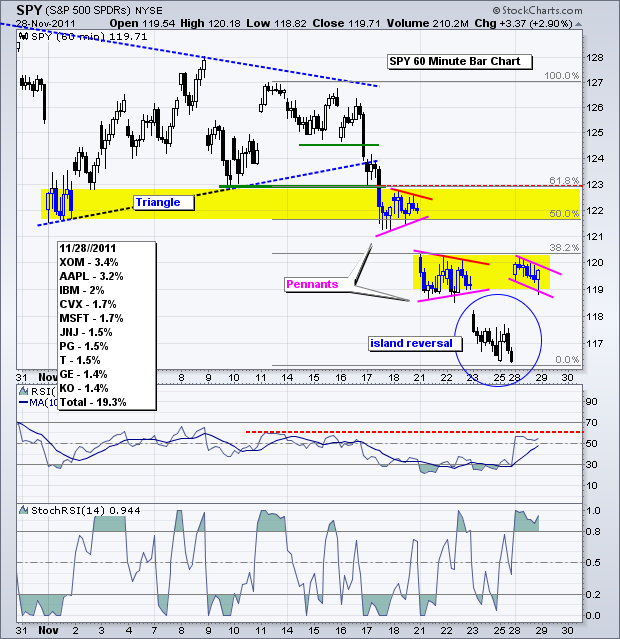
Art's Charts November 28, 2011 at 06:28 AM
Stock futures are trading sharply higher on news (rumors) of an Italian bailout. Also note that it is a big week on the economic front. See the listing of economic reports further down in this commentary. Market moving rumors and innuendo are all part of the game these days... Read More
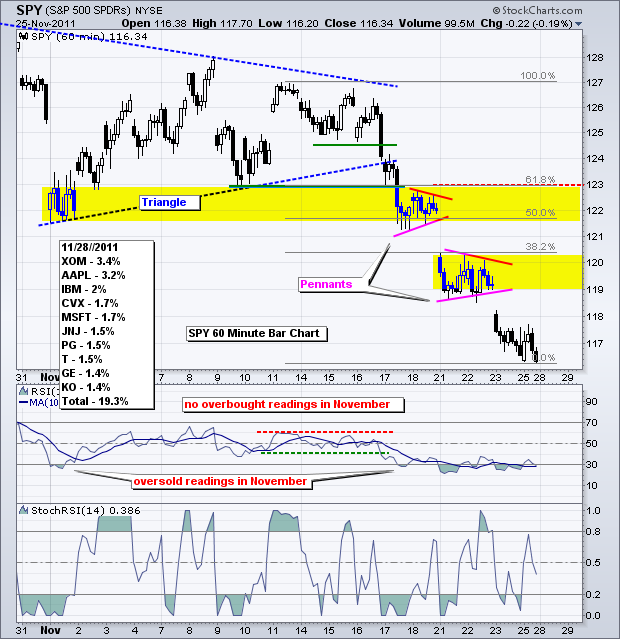
Art's Charts November 23, 2011 at 05:53 AM
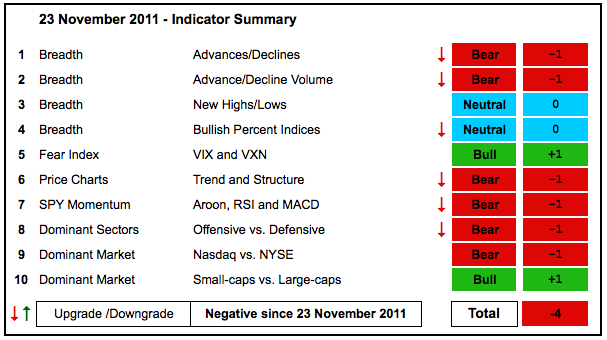
Monday's sharp decline was enough to trigger a slew of downgrades in the indicator summary. I noted on Friday that the indicator was already looking vulnerable and it would not take much to tilt the balance back to the bears... Read More
Art's Charts November 23, 2011 at 04:54 AM
The stock market can fall simply from a lack of buying pressure. In other words, it does not always take an increase in selling pressure to produce a decline. It is pretty easy to come up with reasons not to buy... Read More
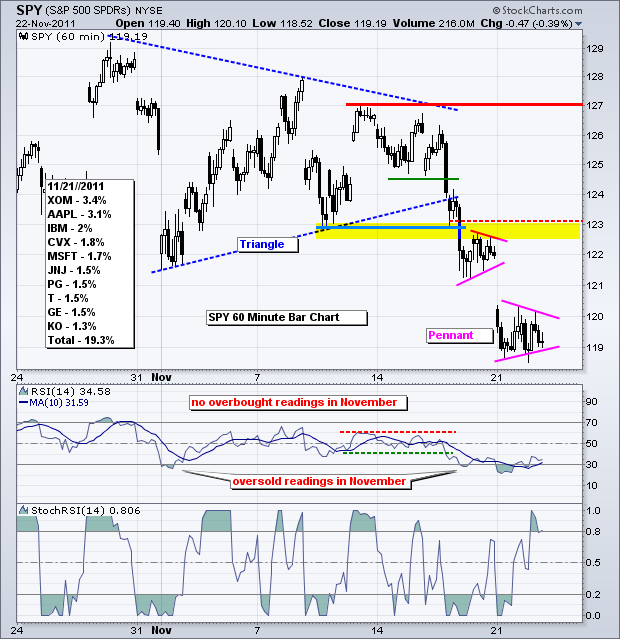
Art's Charts November 22, 2011 at 06:00 AM
With the major index ETFs down 5-6% in the last six trading days, the market is short-term oversold and this could pave the way for a consolidation or oversold bounce... Read More
Art's Charts November 22, 2011 at 05:54 AM
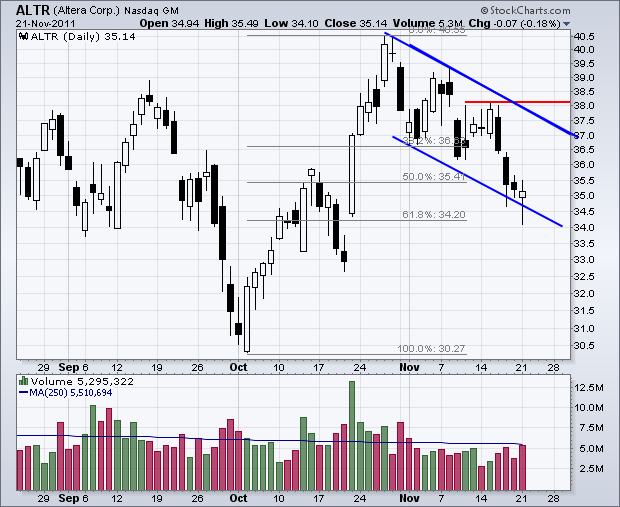
NVDA Buck the Market with Big Surge. URBN Firms with Falling Wedge. WDC Forms Harami with two Inside Days. Plus ALTR, IR and M. This commentary and charts-of-interest are designed to stimulate thinking... Read More
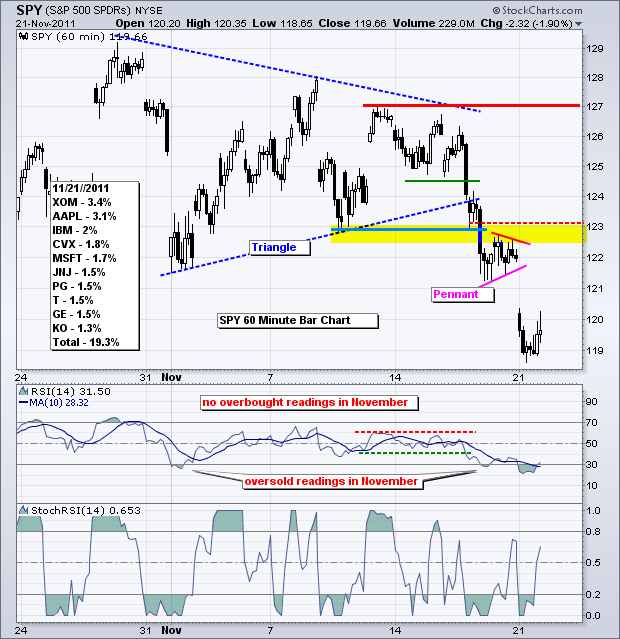
Art's Charts November 21, 2011 at 04:41 AM
The risk-off trade remains the flavor of the month. Stocks broke down last week as the Dollar and Treasuries moved to their highest levels for November... Read More
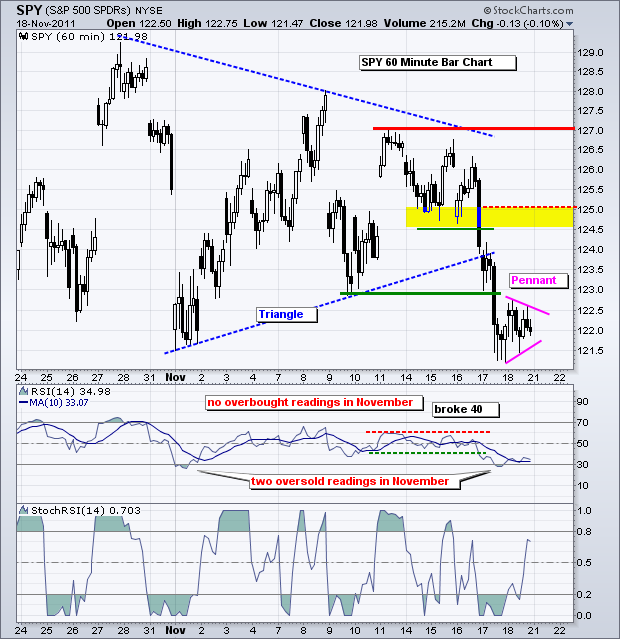
Art's Charts November 18, 2011 at 05:05 AM
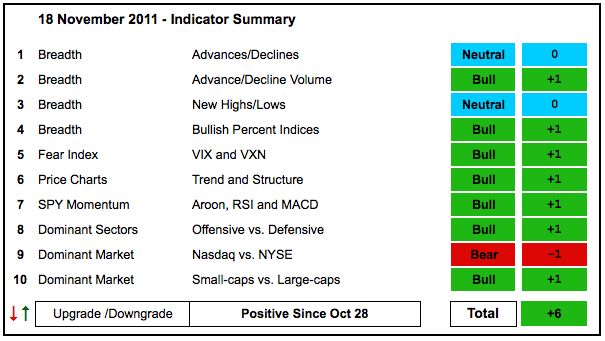
Even though there is no change in the indicator summary, it would not take much to tilt the balance back to the bears. With this week's sharp decline, the major index ETFs are on the verge of support breaks that would question the October breakouts... Read More
Art's Charts November 18, 2011 at 03:49 AM
The risk-off trade took center stage on Thursday. Treasuries and the Dollar were higher, while stocks, commodities and the Euro were lower. Gold followed the stock market again. The S&P 500 ETF (SPY) broke triangle support with a sharp decline over the last two days... Read More
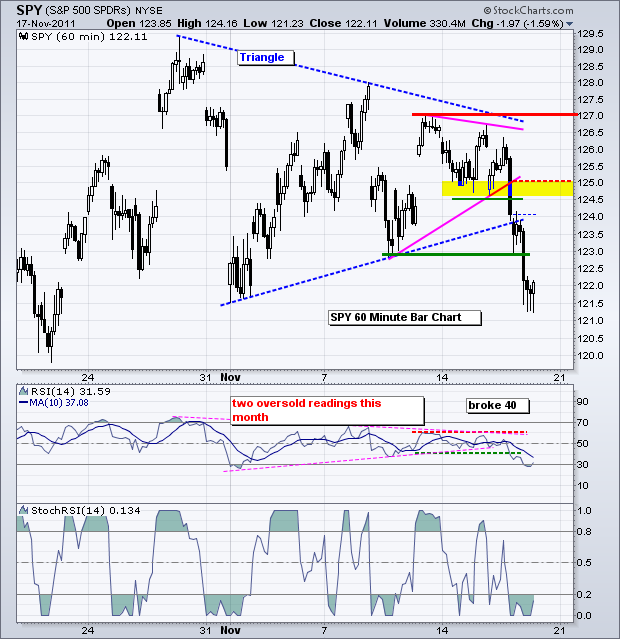
Art's Charts November 17, 2011 at 04:03 AM
With the US Dollar Fund (UUP) hitting its highest level of the month and the 20+ year Bond ETF (TLT) on the verge of a breakout, it is little wonder stocks finally succumbed to some selling pressure... Read More
Art's Charts November 17, 2011 at 03:53 AM
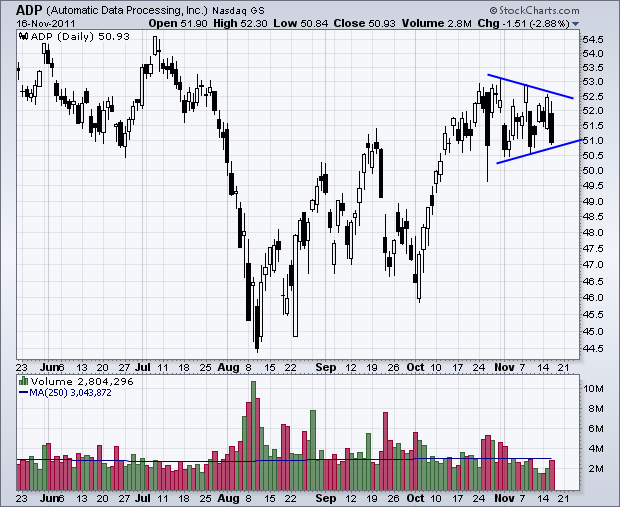
AMZN Forms Rising Wedge in Gap Zone. The Triangle Noose Tightens for CTAS. SYMC Consolidates after Sharp Decline. Plus ADP, INTU, JDSU, MON This commentary and charts-of-interest are designed to stimulate thinking... Read More
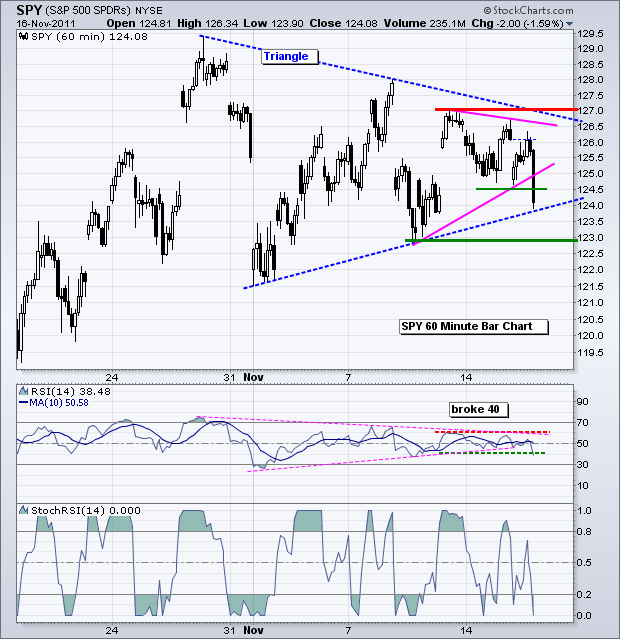
Art's Charts November 16, 2011 at 04:41 AM
Even though the Euro and Treasuries surged off support over the last two days, stocks are holding up and oil remains near $100. It is a paradox and something needs to give here... Read More
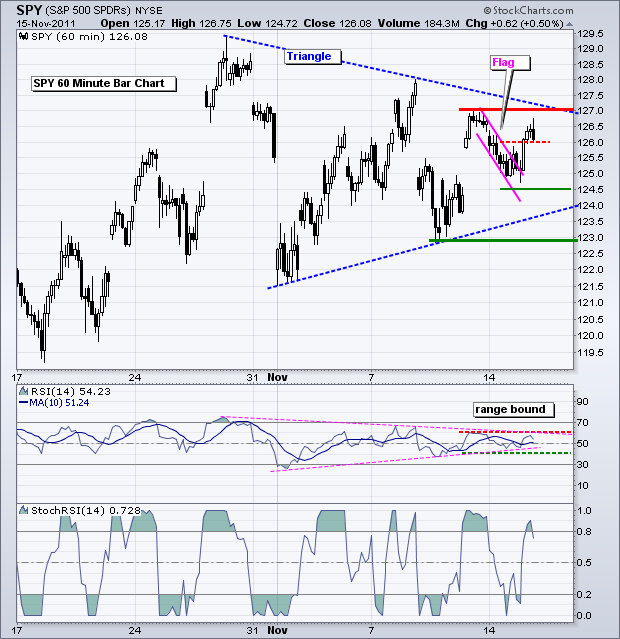
Art's Charts November 15, 2011 at 05:31 AM
The price swings are getting shorter as the triangle tightens in the S&P 500 ETF (SPY). While it is hard to act on every swing within the triangle, this is the only way to anticipate the triangle breakout... Read More
Art's Charts November 15, 2011 at 05:27 AM
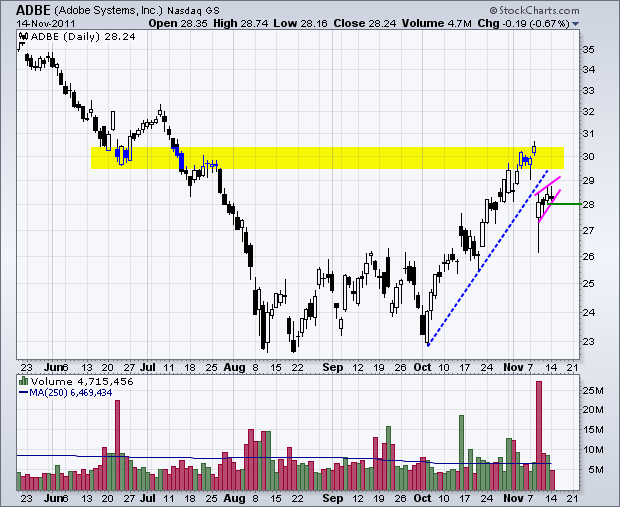
ADBE forms Rising Wedge after Big Gap Down. GCI Hits Resistance at Key Retracement. PG Consolidates at Trendline Support. Plus APOL, FISV, ISIL, SCHL This commentary and charts-of-interest are designed to stimulate thinking... Read More
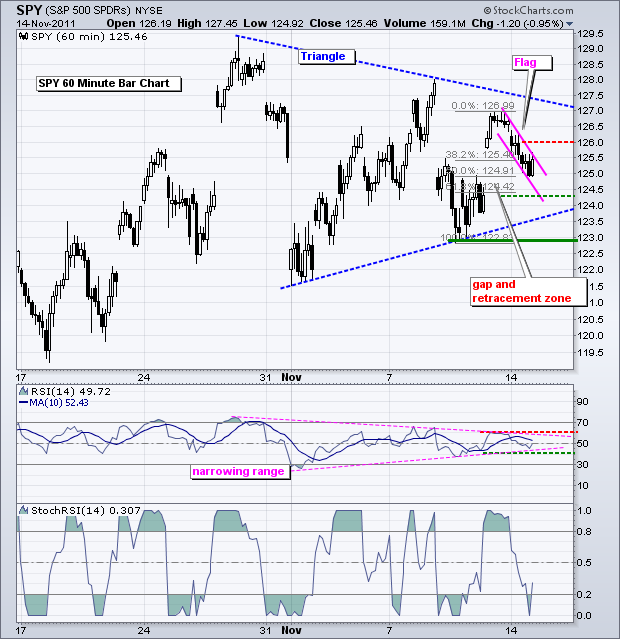
Art's Charts November 14, 2011 at 06:08 AM
As noted on Friday, the S&P 500 ETF (SPY) is in a medium-term uptrend after the October breakout in the 122-124 area. Broken resistance turns into support and the ETF tested this support zone with sharp declines in November... Read More
Art's Charts November 10, 2011 at 11:53 AM
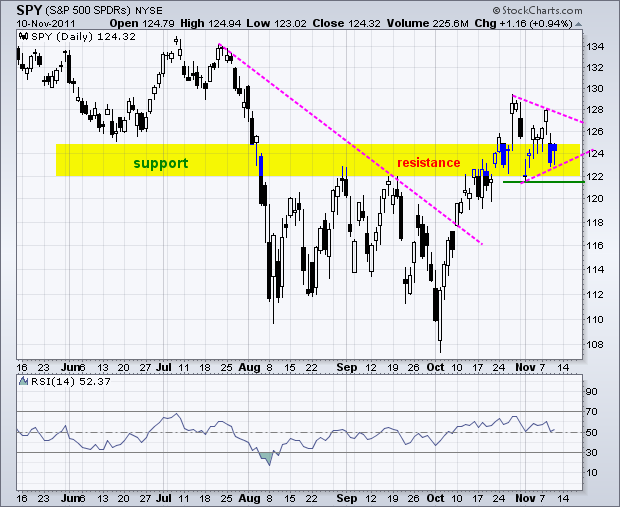
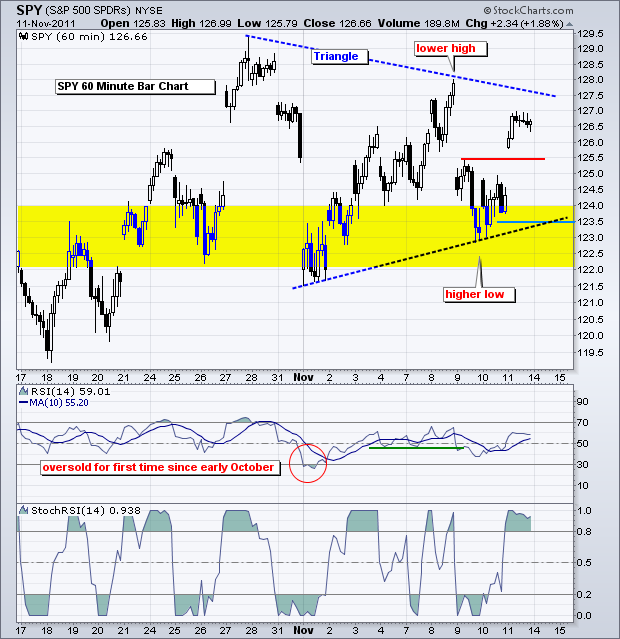
Technically, SPY is in a medium-term uptrend after the October breakout in the 122-124 area. This breakout can be seen on the daily chart below. Broken resistance turns into support and the ETF is currently testing this support zone with two declines into the 122-124 area... Read More
Art's Charts November 10, 2011 at 11:48 AM
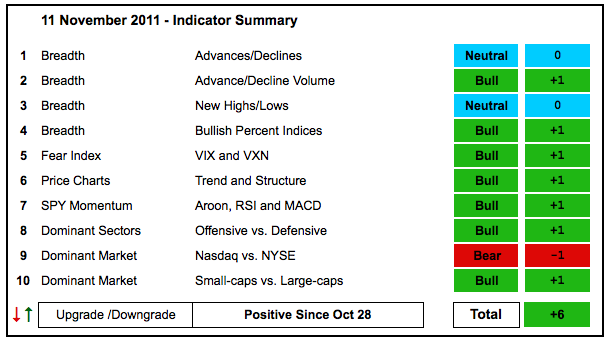
There is no change in the indicator summary as the October breakouts continue to hold. Even though the stock market got shook pretty hard last week and this week, these breakouts are still holding. We cannot question a breakout unless there is a move back below broken resistance... Read More
Art's Charts November 09, 2011 at 10:11 AM
Global equities remain tethered to the Euro and the outlook for the European debt dilemma. Even though a big ocean separates the US from Europe, US traders and investors should keep an eye on the spread between German bond yields and other bond yields, namely Italian and Spanish... Read More
Art's Charts November 09, 2011 at 10:09 AM
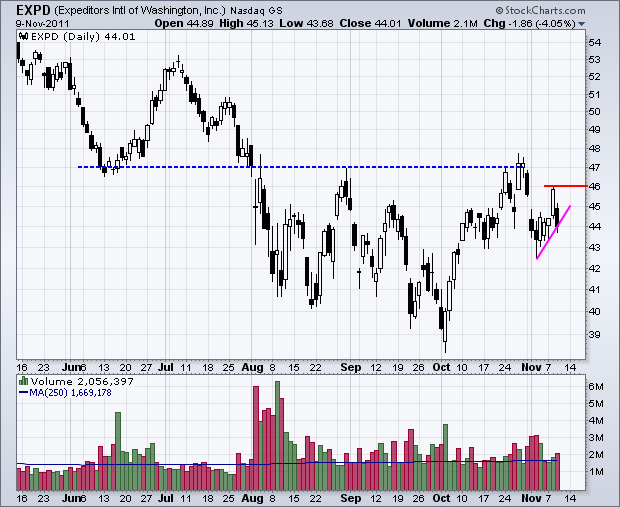
IGT Forms Large Shooting Star. JBHT Hits Resistance at 61.80% Retracement. PLCE Declines from Resistance on High Volume. Plus EXPD and GE This commentary and charts-of-interest are designed to stimulate thinking... Read More
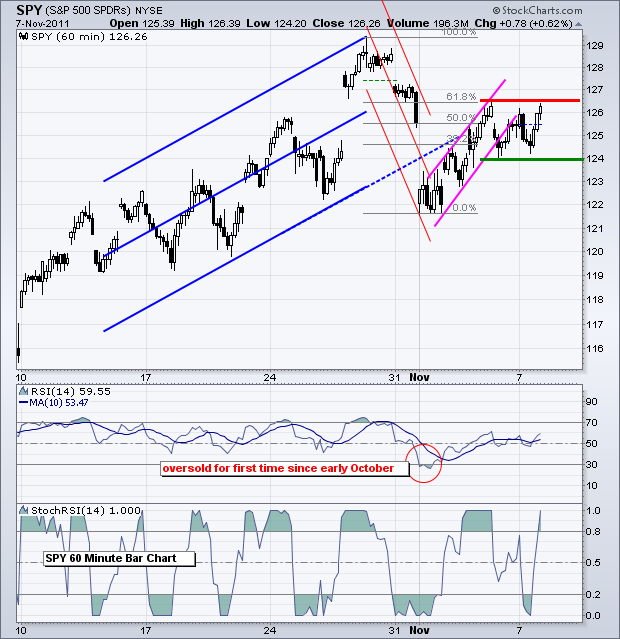
Art's Charts November 09, 2011 at 01:20 AM
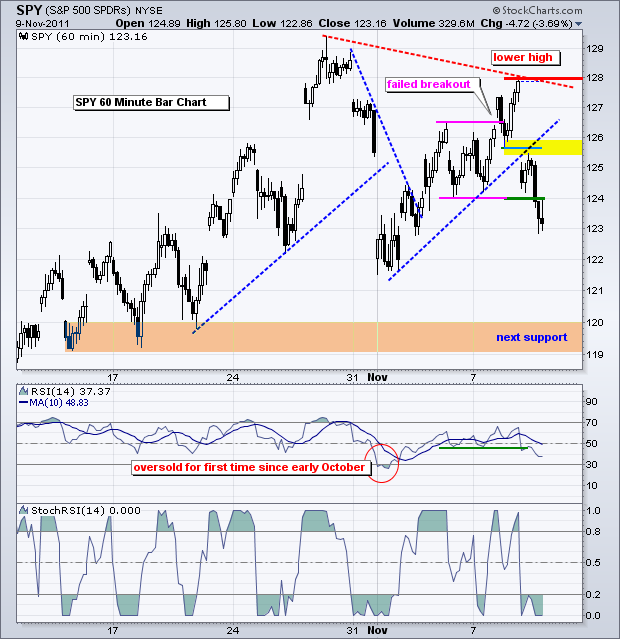
As noted yesterday, the medium-term trend was up because of the resistance breakout in October. This breakout can be seen on a daily chart. Broken resistance in the 122-124 area turned into support and held after the Throwback... Read More
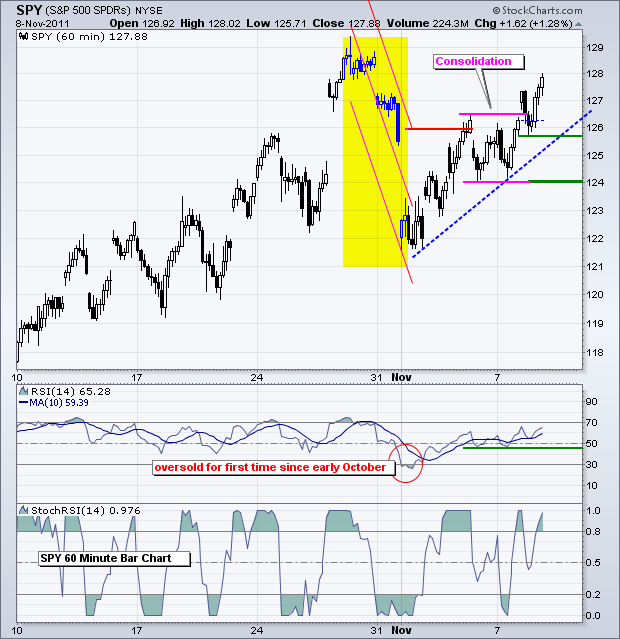
Art's Charts November 08, 2011 at 12:35 PM
Even though SPY formed a bearish rising flag after the plunge to 122, the ETF has yet to break support as a flat consolidation formed the last few days. The ETF broke below the lower trendline of the rising flag on Friday, but quickly rebounded to establish support at 124... Read More
Art's Charts November 08, 2011 at 12:34 PM
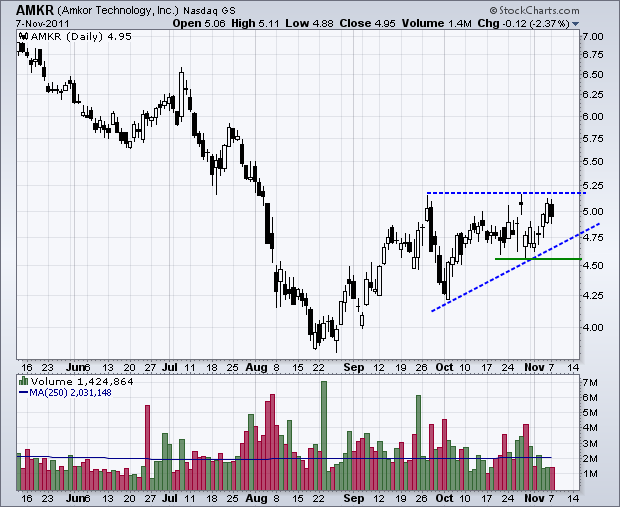
AMKR Forms Ascending Triangle. COST Consolidates Near Resistance. SWKS Breaks Flag Trendline with high Volume. Plus BSX, KGC, MDT, NVDA, WNR This commentary and charts-of-interest are designed to stimulate thinking... Read More
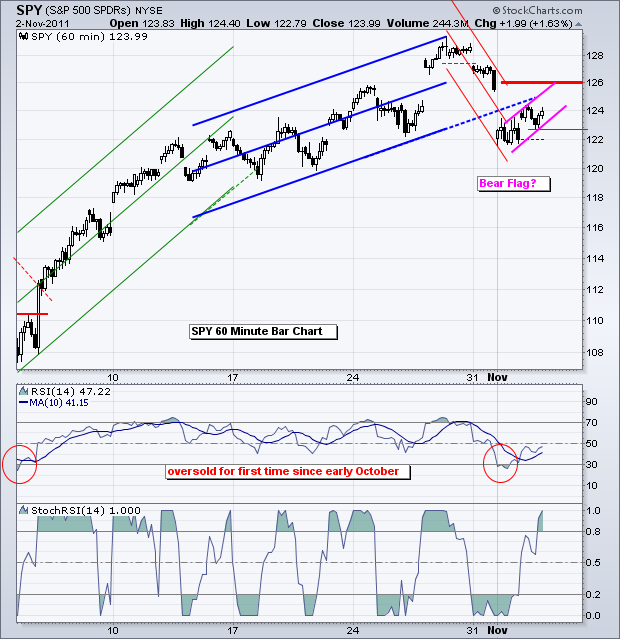
Art's Charts November 03, 2011 at 11:38 AM

The indicator summary remains positive, but breadth is split with the Nasdaq showing less strength. After some weakness early in the week, stocks rebounded on Wednesday-Thursday and the major index ETFs are largely holding their October breakouts... Read More
Art's Charts November 03, 2011 at 09:04 AM
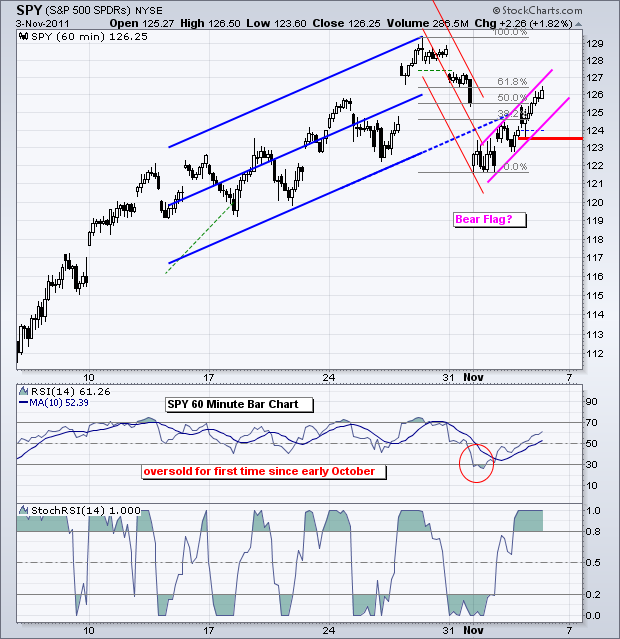
And now for the employment report...Friday's market is at the mercy of the employment report, or rather Wall Street's reaction to the report. The S&P 500 ETF (SPY) bounced off medium-term support in the 122-124 area with a move above 126 the last few days... Read More
Art's Charts November 02, 2011 at 09:28 AM
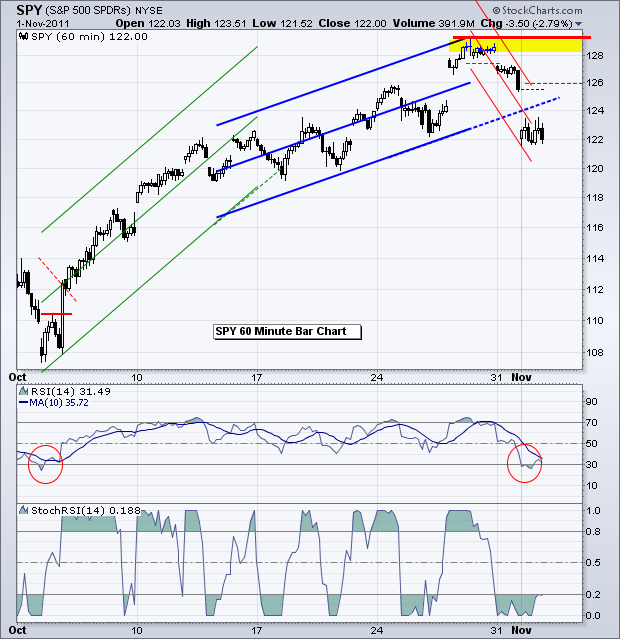
A couple of wrenches, which were thrown out of left field, landed in the flywheel on Monday and Tuesday. While I am not sure the MF Global debacle and Greek referendum are totally to blame for the two day meltdown, there is no questioning the extent of recent selling pressure... Read More
Art's Charts November 02, 2011 at 06:38 AM
The S&P 500 ETF (SPY) broke support with a gap down and then consolidated around 122-124. This zone marks support on the daily chart. Broken resistance from the late August and mid September peaks turns support on this chart... Read More
Art's Charts November 02, 2011 at 06:32 AM
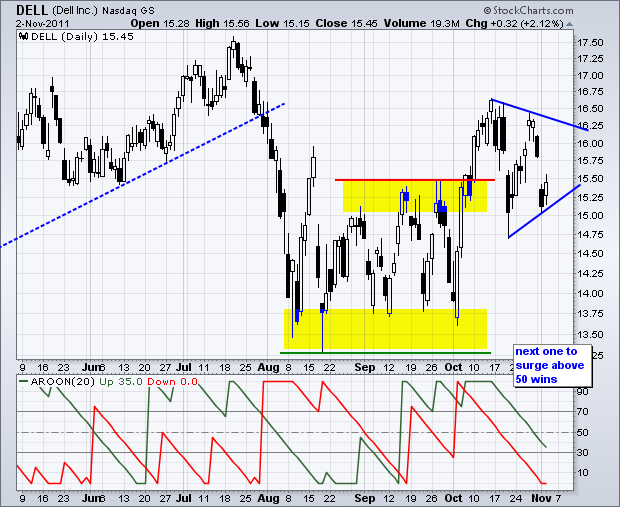
FNSR Breaks Wedge Trendline with Volume. PEP Consolidates after Surge. SBUX Gaps Down and the Gap Remains Unfilled. Plus DELL, MRVL, WFC This commentary and charts-of-interest are designed to stimulate thinking... Read More