Art's Charts January 31, 2014 at 05:31 AM
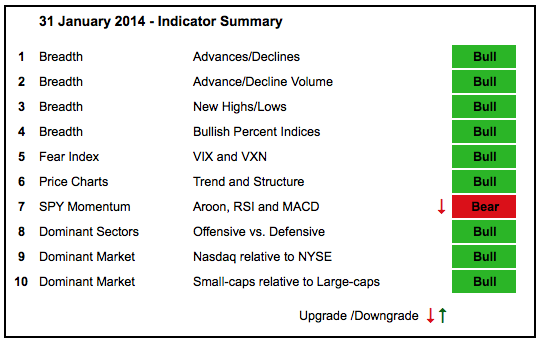
Stocks were hit with more selling pressure and the major index ETFs are now down year-to-date. This was enough to push the momentum indicators into negative territory and prompt a downgrade. This pullback, however, could be just a correction... Read More
Art's Charts January 31, 2014 at 04:15 AM
Stocks got an oversold bounce with the major index ETFs gaining over 1% on the day. All nine sectors moved higher with the consumer discretionary, finance, technology, healthcare and utilities sectors gaining over 1%... Read More
Art's Charts January 30, 2014 at 06:25 AM
ALTR Attempts to Hold Breakout. MSFT Bounces on Good Volume. Plus HUM, HFC, TSO, VZ Individual charts are below video. Sorry but your browser doesn't support HTML5 video... Read More
Art's Charts January 30, 2014 at 03:37 AM
After a small bounce late Monday and Tuesday, stocks opened weak and remained weak on Wednesday. Stocks are still short-term oversold and the long-term trend remains up. This means we have a setup for an oversold bounce... Read More
Art's Charts January 29, 2014 at 03:43 AM
Stocks firmed on Tuesday and managed a bounce with the Russell 2000 ETF (IWM) leading the way. Eight of the nine sectors were up with the Finance SPDR (XLF) and HealthCare SPDR (XLV) advancing over 1.3%... Read More
Art's Charts January 28, 2014 at 06:52 AM
CTXS Lags and Breaks Key Trend Line. CVC Makes a Big Move on Good Volume. Plus DS, DUK, KLAC, MCD Individual charts are below video. Sorry but your browser doesn't support HTML5 video... Read More
Art's Charts January 28, 2014 at 03:50 AM
Stocks started the day weak, got a bounce in the afternoon and then moved lower in the final thirty minutes of trading. Overall, the major index ETFs closed with losses and small-caps led the way lower as IWM fell 1.46%... Read More
Art's Charts January 27, 2014 at 05:02 AM
Stocks were finally hit with strong selling pressure over the last two days. Despite a sharp two-day decline, the bigger trends remain up and the mean reversion players are thinking bounce. SPY fell over 2% for the fourth time since August... Read More
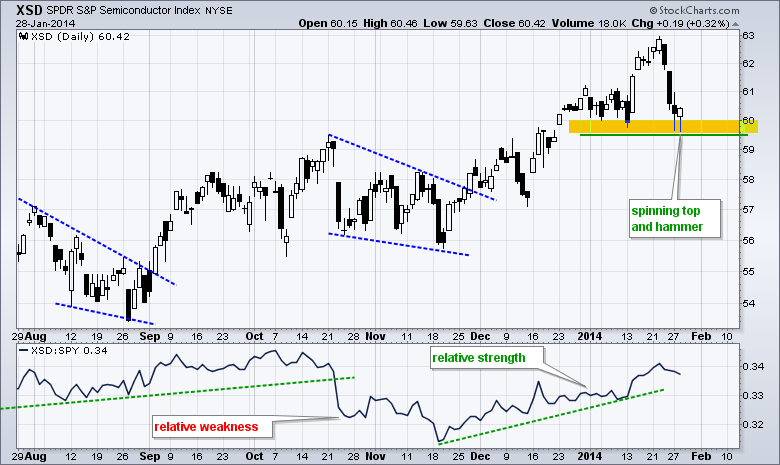
Art's Charts January 24, 2014 at 05:09 AM
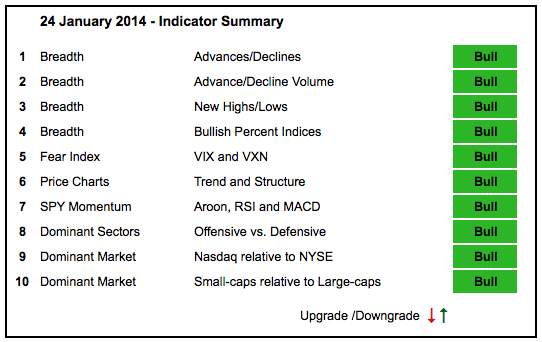
Stocks were hit with some selling pressure this week, but the bigger trends are unaffected and remain up. The market is split with pockets of weakness and pockets of strength... Read More
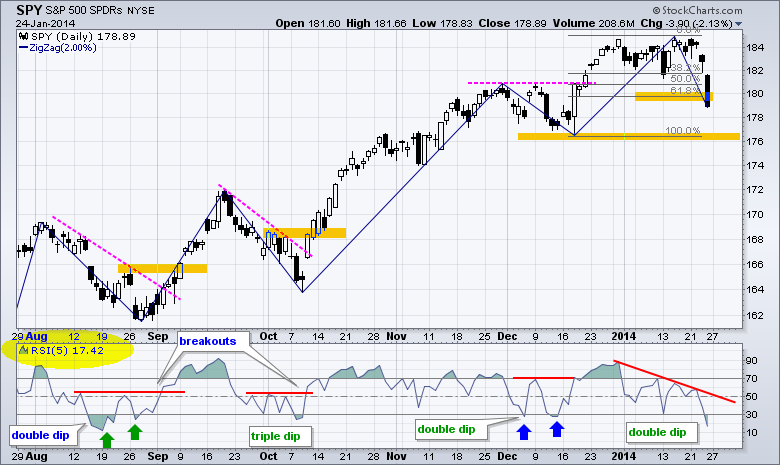
Art's Charts January 24, 2014 at 03:28 AM
Stocks got hit with selling pressure, but the declines were not that deep. The Dow Diamonds (DIA) led the way lower with a 1.08% loss. The Nasdaq 100 ETF (QQQ) held up the best with a .38% decline. All sectors were down with three of the four offensive sectors loosing over 1%... Read More
Art's Charts January 23, 2014 at 06:13 AM
The edging continues as stocks once again edged higher with techs and small-caps leading the way. The Dow Diamonds (DIA) once again lagged with a small loss, which can be blamed on IBM... Read More
Art's Charts January 23, 2014 at 06:09 AM
AFL Underperforms with Bearish Pennant. CIEN Recovers after Break Down. Plus DDR, HRB, IP, JOY, OXY Individual charts are below video. Sorry but your browser doesn't support HTML5 video... Read More
Art's Charts January 22, 2014 at 04:48 AM
Stocks edged higher on Tuesday, which fits with the seasonal tendencies after a three day weekend in January. The Russell 2000 ETF (IWM) led the way with a .60% gain. The Dow Diamonds (DIA) lagged with a .21% loss though... Read More
Art's Charts January 21, 2014 at 06:53 AM
Stocks were all over the place last week and ended mixed. The major index ETFs swooned on Monday, but recovered with a surge on Tuesday and strong open on Wednesday. A little profit taking took hold on Thursday-Friday as stocks gave some back at the end of the week... Read More
Art's Charts January 21, 2014 at 06:50 AM
Download 140121acCNL Holds Triangle Breakout. CPB Fails at Resistance. Plus FAST, LOW, PNRA, GLQC Individual charts are below video. Sorry but your browser doesn't support HTML5 video... Read More
Art's Charts January 17, 2014 at 04:37 AM
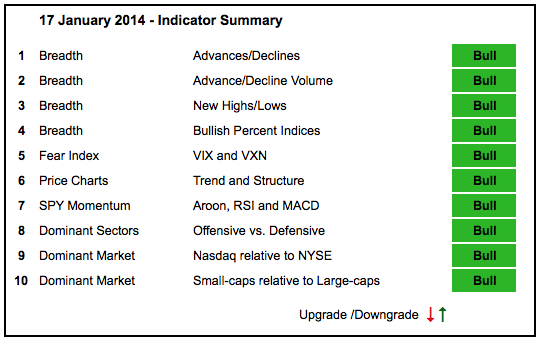
New highs say it all. The AD Lines and AD Volume Lines hit new highs. Four of the five major index ETFs also hit new highs, as did two of the four offensive sectors hit new highs... Read More
Art's Charts January 17, 2014 at 03:34 AM
It was a mixed day for stocks as the major index ETFs treaded water most of the day. The Russell 2000 ETF (IWM) edged higher (+.12%), while the S&P 500 SPDR (SPY) edged lower (-.13%)... Read More
Art's Charts January 16, 2014 at 06:33 AM
Stocks continued higher with the tech sector leading once again. In fact, three of the four offensive sectors led what was really a mixed market. XLK and XLF gained over 1%, while XLI advanced .61%. The Consumer Discretionary SPDR (XLY), however, only managed a .24% gain... Read More
Art's Charts January 16, 2014 at 06:30 AM
BOOM Forms Long Bullish Consolidation. BRCM Forms Bull Pennant after Breakout. Plus CERN, CHRW, CTXS, URBN Individual charts are below video. Sorry but your browser doesn't support HTML5 video... Read More
Art's Charts January 15, 2014 at 06:48 AM
After one day of selling pressure on Monday, stocks rebounded with the technology sector leading the way. Networking stocks held up well during Monday's decline and semiconductor stocks led the way on Tuesday... Read More
Art's Charts January 14, 2014 at 05:49 AM
Stocks were hit with a broad-based selloff, but selling pressure was not that intense. The Russell 2000 ETF (IWM) led the way lower with a 1.05% decline and the Nasdaq 100 ETF (QQQ) held up the best with a .74% loss... Read More
Art's Charts January 14, 2014 at 05:44 AM
AAPL Firms near Key Retracement. AN Breaks Trend Line with Volume Expansion. Plus CNX, EBAY, IBM, JOY Individual charts are below video. Sorry but your browser doesn't support HTML5 video... Read More
Art's Charts January 13, 2014 at 05:13 AM
Despite a big miss for December non-farm payrolls, stocks managed to finish strong and end the week on an up note. The S&P MidCap SPDR (MDY) led the market with a .74% gain, while the Dow Diamonds (DIA) lagged with a .01% loss... Read More
Art's Charts January 10, 2014 at 04:40 AM

Stocks did not do much this week (as of Thursday) and there is no change in the indicator summary. The AD Lines and AD Volume Lines are in clear uptrends with new highs over the last few weeks. The offensive sectors are leading with XLF hitting a new high this week... Read More
Art's Charts January 10, 2014 at 03:32 AM
Stocks continued their mixed ways with the Russell 2000 ETF (IWM) closing fractionally higher (-.03%) and the Nasdaq 100 ETF (QQQ) edging lower (-.33%). The technology sector led the way lower as networking, internet and semis came under selling pressure... Read More
Art's Charts January 09, 2014 at 06:40 AM
Stocks were mixed on Wednesday as investors digested the strong ADP report and the prospects of further tapering down the road. Actually, strong job numbers and tapering are nothing new... Read More
Art's Charts January 09, 2014 at 06:36 AM
AAN Bounces off Support on Good Volume. CIEN Challenges Resistance. Plus $JBLU, MEDI, SWK and WAG. Individual charts are below video. Sorry but your browser doesn't support HTML5 video... Read More
Art's Charts January 08, 2014 at 04:51 AM
Turnaround Tuesday took hold as stocks bounced to end the 2014 slump, which lasted a whole three days. The gains, however, were relatively muted as participants held back ahead of Friday's employment report... Read More
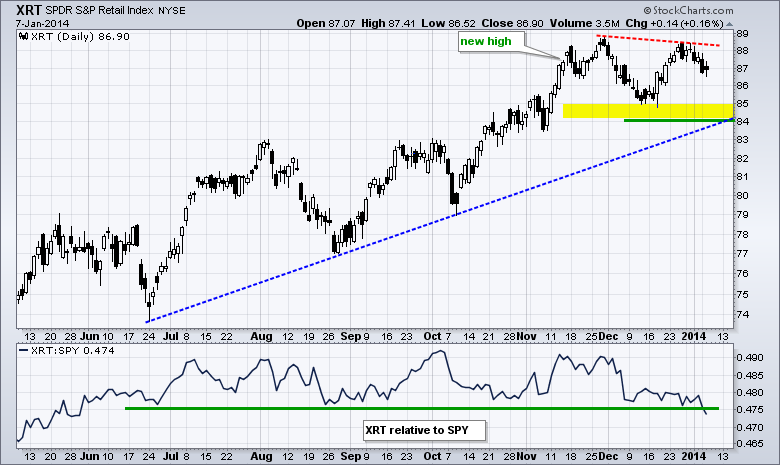
Art's Charts January 07, 2014 at 06:55 AM
Stocks extended their correction with relatively mild selling pressure. The Russell 2000 ETF (IWM) led the decline with a .81% loss, but the S&P 500 SPDR (SPY) only lost .29% on the day... Read More
Art's Charts January 07, 2014 at 06:51 AM
AAPL Hits Key Level as Volume Ticks Higher. BMY Forms a Pennant. Plus EA, GME, WDAY Individual charts are below video. Sorry but your browser doesn't support HTML5 video... Read More
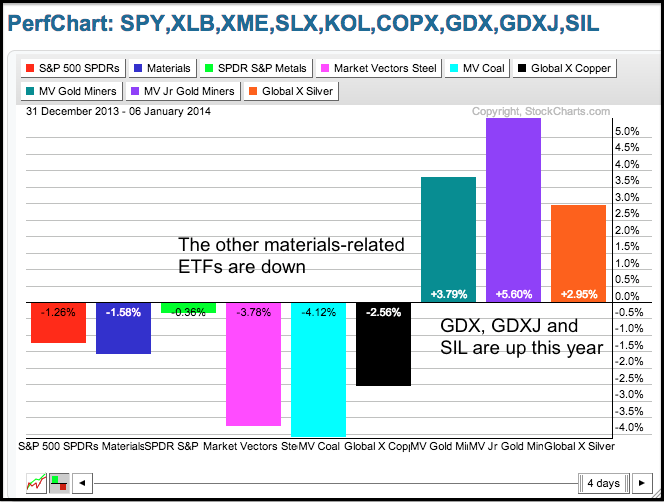
Art's Charts January 06, 2014 at 05:06 AM
Stocks got off to a rough start in 2014, but the big trends were unaffected by this relatively shallow pullback. In fact, a two day pullback after an eleven day advance is pretty normal. Techs were hit Thursday and Friday as the Nasdaq 100 ETF (QQQ) fell 1.5%... Read More
Art's Charts January 03, 2014 at 05:28 AM
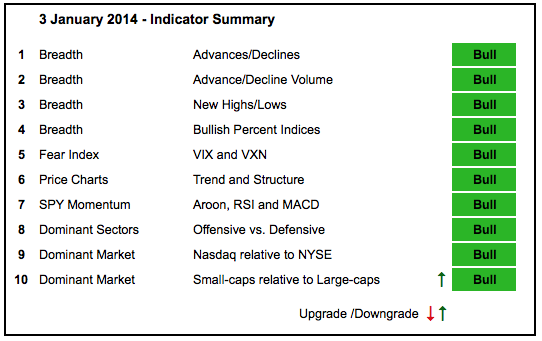
Stocks finished the year strong as the major index ETFs and offensive sector SPDRs hit new highs. These new highs were confirmed with new highs in the AD Lines and AD Volume Lines. Net New Highs also expanded as the High-Low Lines hit new highs... Read More
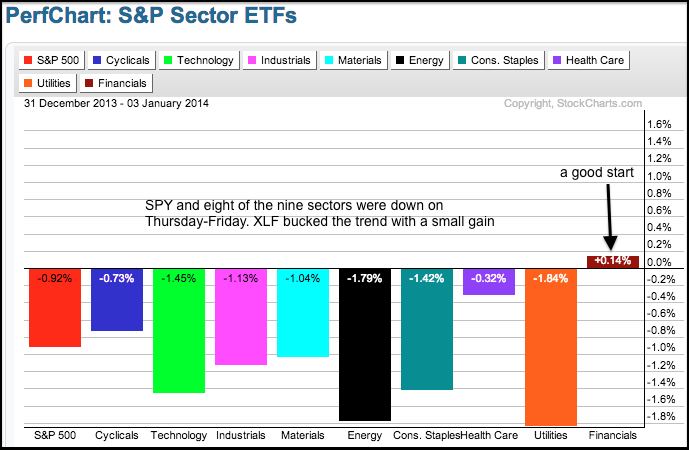
Art's Charts January 03, 2014 at 04:10 AM
Stocks were hit with selling pressure on the first trading day of the year. A little profit taking after a sharp eleven day advance is pretty normal... Read More
Art's Charts January 02, 2014 at 07:31 AM
COP Firms on Good Volume. FLSR Continues to Show Relative Weakness. Plus GPS, LUB, PG, TSM Individual charts are below video. Sorry but your browser doesn't support HTML5 video... Read More
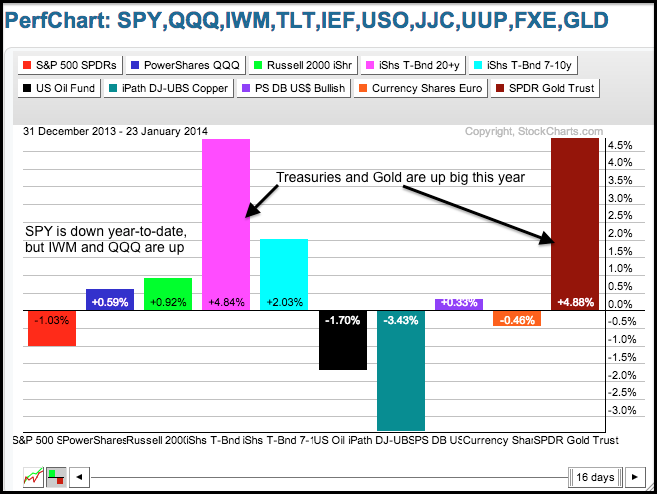
Art's Charts January 02, 2014 at 05:30 AM
Seasonality worked quite well over the last two weeks as the major index ETFs surged from December 16th to yearend. All were up 4% or more over the last eleven trading days. The Russell 2000 ETF (IWM) and Dow Diamonds (DIA) led with gains exceeding 5%... Read More