ChartWatchers May 19, 2007 at 10:06 PM
Folks, we're merely in the second or third inning of a nine inning game. Let there be no doubt, the bulls are in charge. And they will remain in charge. This current bull rally goes beyond interest rates, earnings, inflation, blah, blah, blah... Read More
ChartWatchers May 19, 2007 at 10:04 PM
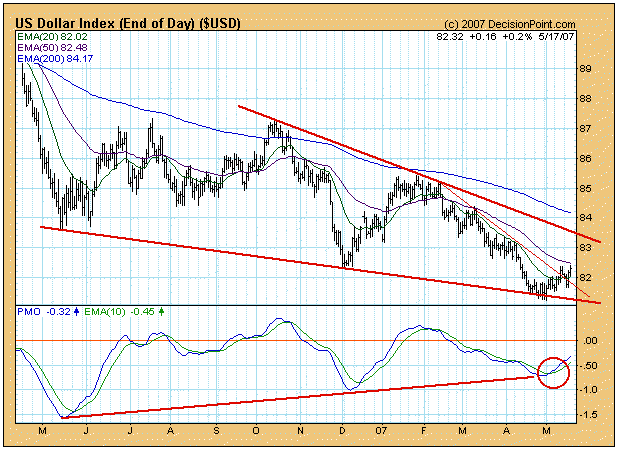
The U.S. Dollar is trying to turn up for the fourth time since it topped in 2004, but this bottom looks more promising than the prior three... Read More
ChartWatchers May 19, 2007 at 10:03 PM
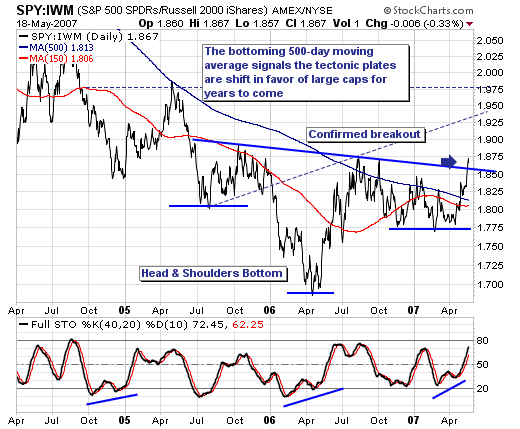
We recently featured the S&P 500 Large Cap vs. Russell 2000 Small Cap ratio surrogate using the ETFs SPY:IWM; with the implication that the tectonic plates were shifting beneath the markets, with large caps slowly, but surely coming back to favor at the expense... Read More
ChartWatchers May 19, 2007 at 10:00 PM
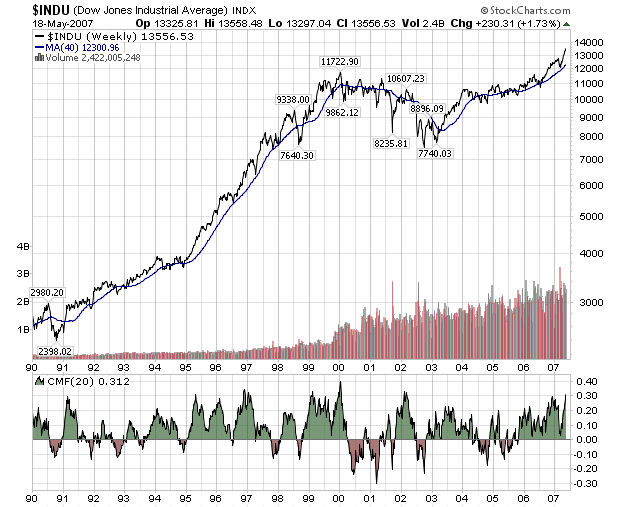
The Dow Jones Industrials continues to rise week after week setting new records as it goes. I thought it would be good to take a quick look back and see if history can teach us anything about what the Dow does to signal the end of these long up-trends... Read More
ChartWatchers May 05, 2007 at 10:06 PM
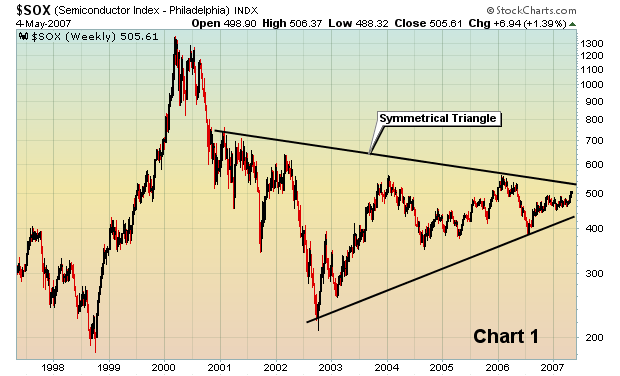
We've been watching and following the semiconductors for the past many months, awaiting their attempt to join the stock market's rally. But it hadn't happened....until this past week... Read More
ChartWatchers May 05, 2007 at 10:05 PM
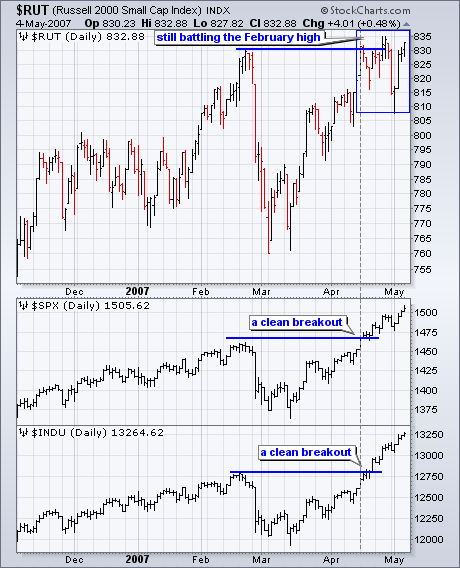
Even though the Dow is trading at all time highs and the S&P 500 is trading above 1500 for the first time since 2000, the Russell 2000 continues having trouble with resistance around 830. Thinking in terms of Dow Theory, I view this as a non-confirmation... Read More
ChartWatchers May 05, 2007 at 10:04 PM
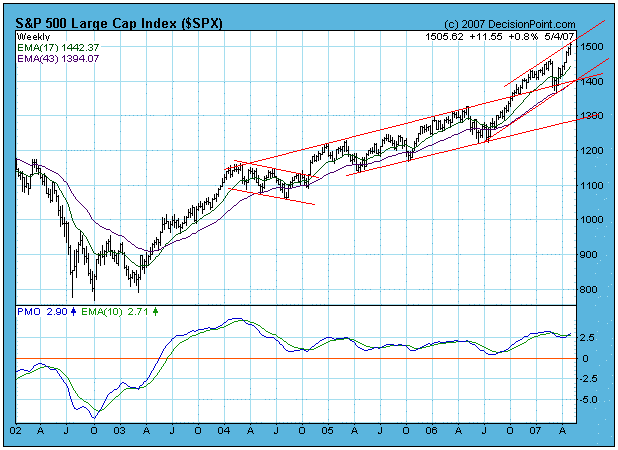
The weekly chart of the S&P 500 Index below reveal that prices are behaving in a very bullish fashion. The index has broken above the gradually rising trend channel that prevailed from 2004... Read More
ChartWatchers May 05, 2007 at 10:02 PM

NOTHING SPECIAL HAPPENING HERE - NOPE - It's certainly not worth your time to completely read Chip's article this week. Nope. I'd just skip it entirely... Read More
ChartWatchers May 05, 2007 at 10:01 PM
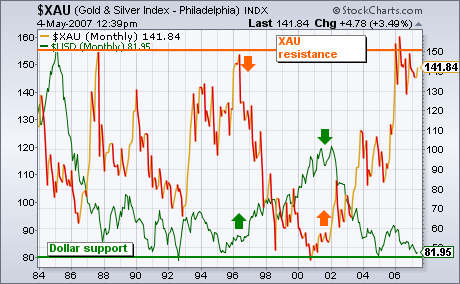
One of the most consistent of all intermarket relationship is the inverse relationship between gold assets and the U.S. Dollar. Nowhere is that more evident than in the chart below. The green line plots the U.S... Read More
ChartWatchers May 05, 2007 at 10:00 PM
Our Spring Special is running throughout the month of May! Let me repeat that in case you missed it: Our Spring Special is on from now until May 31st! Sorry for the blatant plug, but every time one of these special periods end, we get flooded with message from people who claim th... Read More