ChartWatchers June 22, 2008 at 10:05 PM
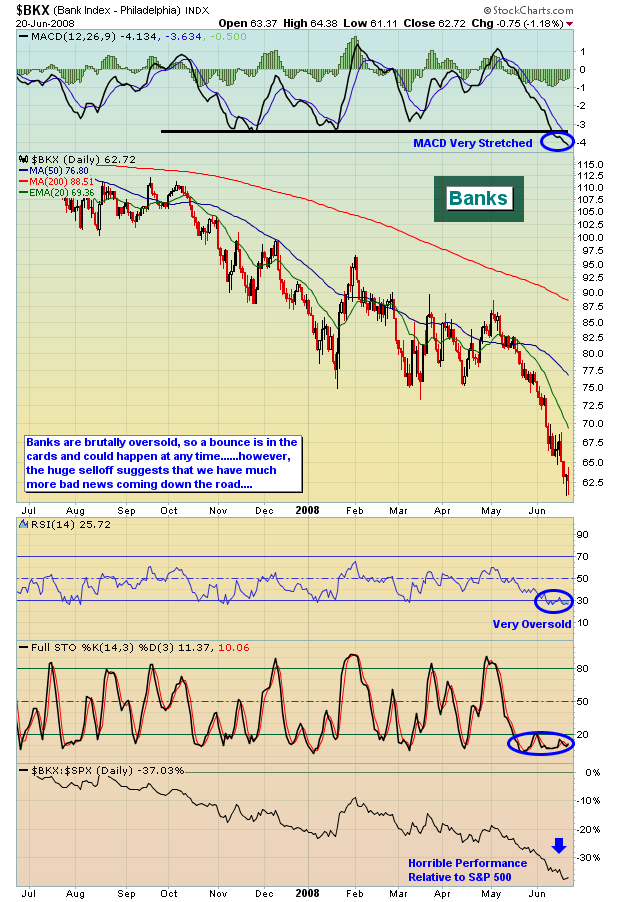
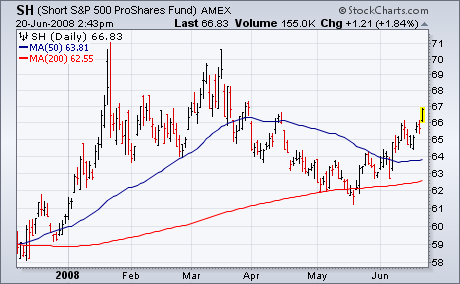
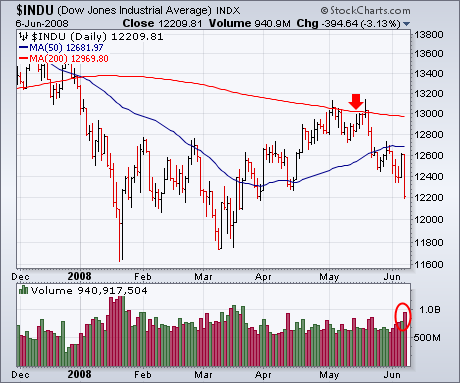
On May 19th, I discussed what appeared to be a topping market. Since that time, the Dow has lost 8.82%. The S&P 500 has lost 7.51%. The NASDAQ has lost 4.86%. The SOX has lost 9.24%. The XLF (an ETF that tracks financials) has lost 16.67%. The bank index has lost 22.32%... Read More
ChartWatchers June 22, 2008 at 10:04 PM
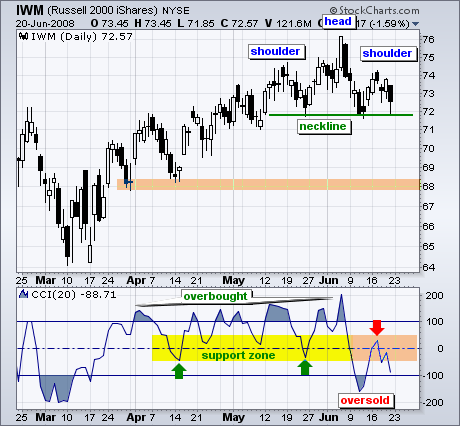
Despite a big decline in the S&P 500 ETF (SPY) over the last five weeks, the Russell 2000 ETF (IWM) has been holding up pretty well. However, a bearish reversal pattern and weakening momentum suggest that IWM will ultimately follow its big brother lower... Read More
ChartWatchers June 22, 2008 at 10:03 PM
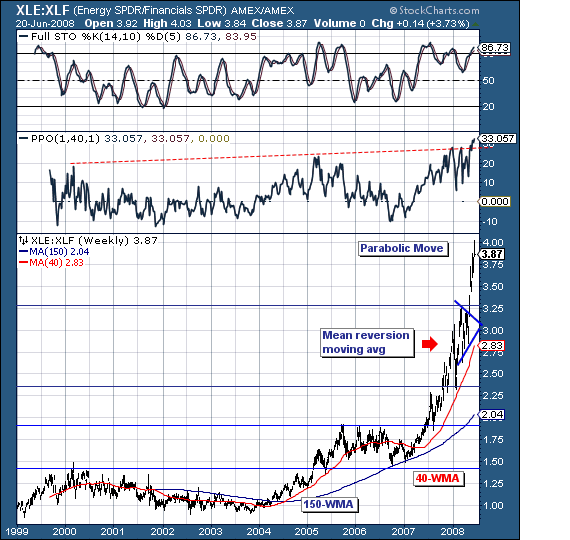
Discussions about the price of oil are in the news every day, but my observation is that, for the most part, these discussions serve only to confuse the public more. Most popular are the conspiracy theories, blaming the high prices on shadowy behind-the-scenes manipulators... Read More
ChartWatchers June 22, 2008 at 10:02 PM
As the world stock markets have embarked on what arguably is another "leg lower"; we are left to wonder aloud what the relative rotation beneath the surface of this decline will look like in terms of tactical allocation... Read More
ChartWatchers June 22, 2008 at 10:01 PM
THE FED'S IN A BOX ... I've written recently about the Fed turning its attention away from the economy and back to inflation. Unfortunately, this week's market downturn is going to make its job a lot harder... Read More
ChartWatchers June 22, 2008 at 10:00 PM
This weekend we've updated our ChartNotes chart annotation tool. On the surface everything looks the same, but for frequent ChartNotes users that are willing to remember a couple of new keyboard/mouse combinations, things should be much better... Read More
ChartWatchers June 08, 2008 at 10:05 PM
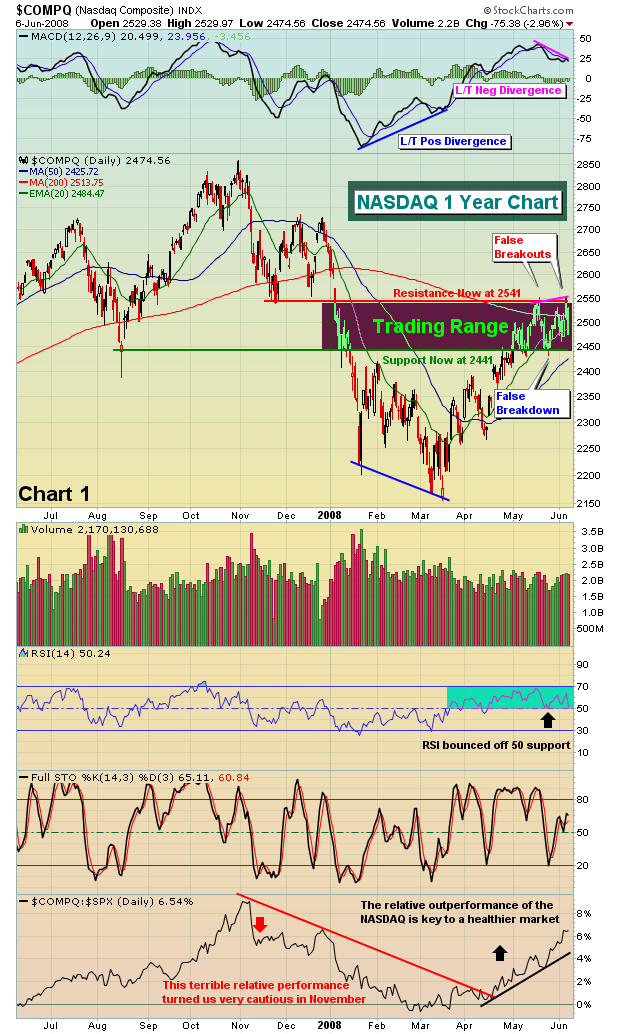
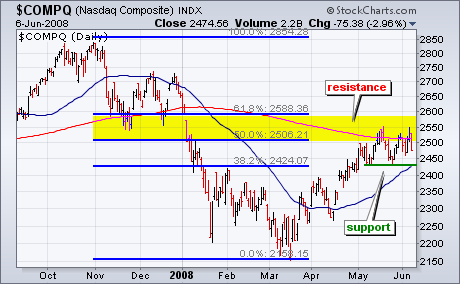
Let's focus first on one of the strongest indices, the NASDAQ. Technology stocks have been performing quite well and there's been a challenge for the tech-heavy NASDAQ to pierce price resistance at 2541... Read More
ChartWatchers June 08, 2008 at 10:04 PM
Even though techs and small-caps have been showing relative strength the last several weeks, the Nasdaq and the Russell 2000 are running into stiff resistance of their own. Their charts show similar setups that point to a medium-term peak... Read More
ChartWatchers June 08, 2008 at 10:03 PM
There are three market indexes that capture the most attention: The Dow Jones Industrial Average (DJIA), the S&P 500 Index (SPX), and the Nasdaq 100 Index (NDX). Together they represent about 80% of the total U.S. market capitalization... Read More
ChartWatchers June 08, 2008 at 10:02 PM
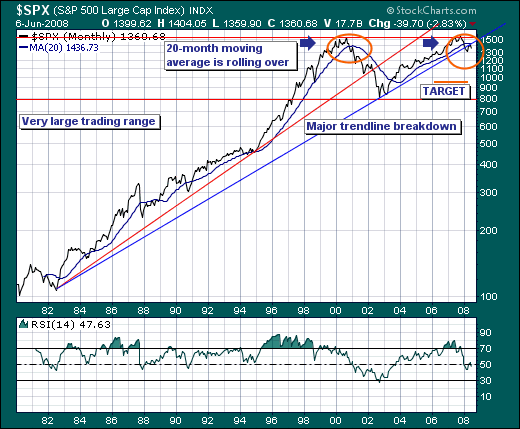
When markets become as volatile as they have in the past week; it is best to stand back and take a look at the longer-term time horizon... Read More
ChartWatchers June 08, 2008 at 10:01 PM
There have been two consistent themes that myself and Arthur Hill have been stressing in recent Market Messages. One has been that the rally from mid-March is a bear market rally. The other has been that the rally has probably ended... Read More
ChartWatchers June 08, 2008 at 10:00 PM
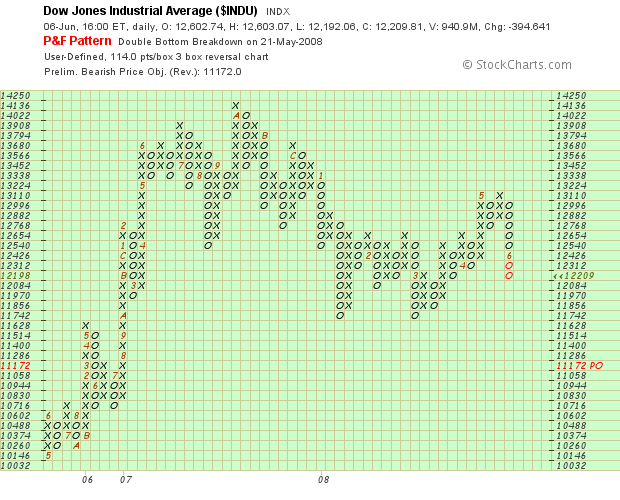
StockCharts now has four different "time independent" forms of charting. I thought I'd take some time this week to introduce you to all four. A "Time Independent" chart is a chart that doesn't have a consistent horizontal axis... Read More