StockCharts.com has a nice Dynamic Yield Curve tool that anyone can use. It's extremely friendly. As we roll through the pictures in this article, notice the date in the upper left corner of the yellow box. The red vertical line on the yellow background on the right side shows it in the context of the stock market.
Here is a snapshot of the tool on July 12, 2016.
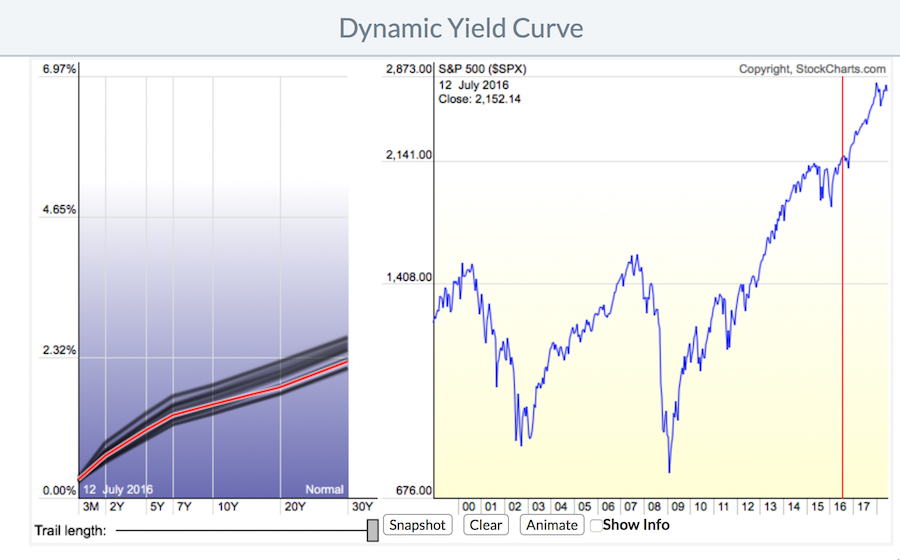
In the picture above, we can see the line tilted sharply higher. The black shading is the yield each of the bond maturity dates have travelled and the red is the line at the snapshot in time. About 2% between the high and the low.
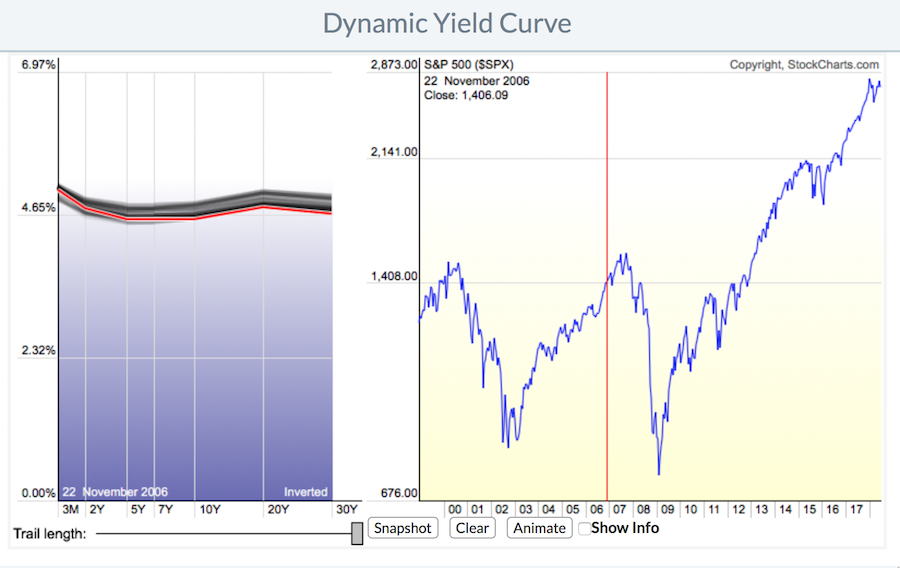
Back in 2006, the yield curve flattened. The yield curve had lower interest rates on the long term bonds (30-Year) compared to the shorter duration notes (3 month and one year). I picked a date in 2006, I did not try to pick the first inversion. The important thing to notice is the stock market ran a lot further. It can take a year or two for the stock market to top out with an inverted (right side is lower than the left) yield curve.
 You do not always have an inverted yield curve to have drops like 2010, 2011, or 2015.
So the day this ticks negative into an inverted yield curve, alarm bells on the business news channels will be ringing focusing on you to watch their show for every tick of the yield curve. Let the market internals tell you when to be involved, not the yield curve. The yield curve will be one of the check marks for a list of problems that ends up holding back the market. Some of the Federal Reserve members have publicly commented that they are very aware of the message an inverted yield curve sends and would not want to push that signal in the market.
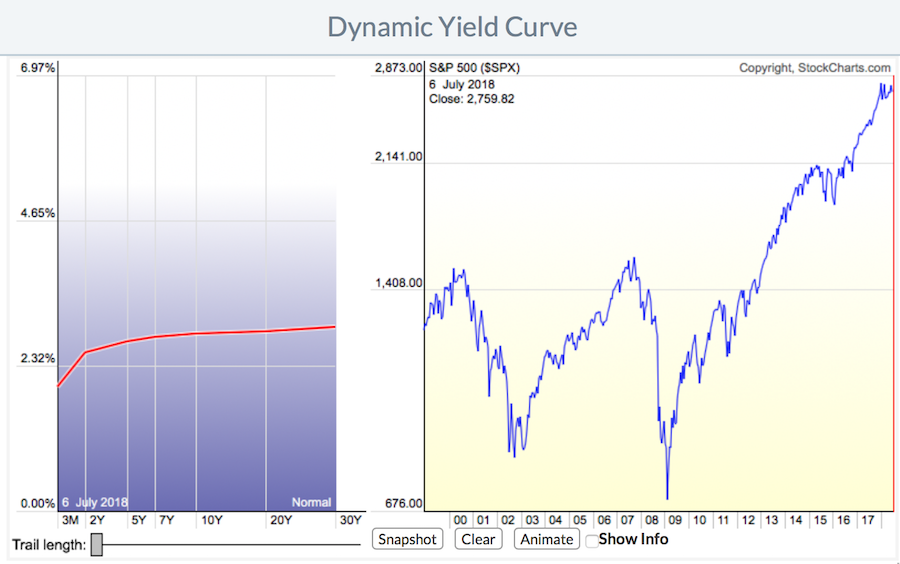
Here is the current status of the market. I set the trail length to zero to just focus on the current position. There is a slight upward taper but nothing like the July 2016 picture.
 For more fun today, you can play with the Dynamic Yield Curve here. You can find it on the Free Charts page. Drag the red vertical line to the left and see the chart change shape. You can also hit the animate button. I cover the bond yields in my Commodities Countdown often, but not every week. Links are supplied below to my Vimeo Channel, and the Commodities Countdown blog.
Here is the half year review edition of the Commodity Countdown. I focus in on the setup in Gold and Silver. The GDX rallied 1.34% this week and broke through some trend lines. Remember, commodities should be bought near their lows! The Nasdaq and the Toronto Stock Exchange both failed to hold their breakouts to new highs so this video covers off what to watch for. The Bullish Percent indexes are particularly precarious.
The Final Bar recording for Thursday July 5th contains information on the potential for rollover in the $USD. It also covers the recent surge in the advance/decline data.
For Canadian investors, here is a copy of the most recent Canadian Technician video. Canada suffered a failed breakout to end June. But if you are interested in Gold and Silver stocks I roll through 40 of them. Many are dual listed in the US and Canada.
If you are missing clues on signals in the market, follow me on Twitter and check out my Vimeo Channel often. Bookmark it for easy access!
It's the Calgary Stampede this week. Hopefully this will kick off another bull market surge in July like in 2017! The JPM chart is a great example for 2017. Financials rallied and JPM went from $85 to $115.
Good trading,
Greg Schnell, CMT, MFTA
Senior Technical Analyst, StockCharts.com
Author, Stock Charts for Dummies
Want to read more from Greg? Be sure to follow his two StockCharts blogs:
Commodities Countdown and The Canadian Technician
