MailBag February 26, 2010 at 08:00 AM
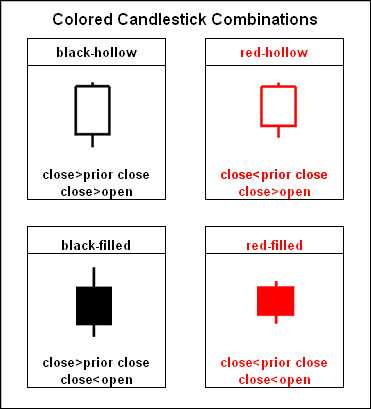
Candlestick coloring is a timely issue because many ETFs and stocks formed red-hollow candlesticks on Thursday (24-Feb-10). First, let’s review the different combinations possible. Colored candlesticks are made up of four components in two groups. First, a down close gets a red candlestick and an up close gets a black candlestick. Second, a candlestick is hollow when the close is above the open and filled when the close is below the open. The table below shows the four combinations. Each candlestick tells a price action story. In particular, the hollow Read More
MailBag February 19, 2010 at 08:13 AM
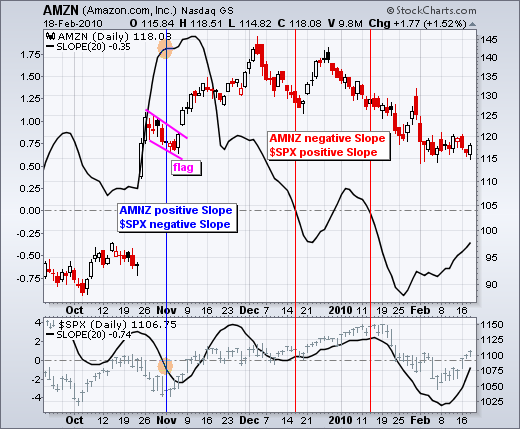
Slope can be used to measure relative strength or weakness. First, let’s define the indicator. Slope measures the rise-over-run of a linear regression, which is the line of best fit over a specific timeframe. A 20-day Linear Regression would show the line of best fit for closing prices over a 20-day period. A 20-day Slope would reflect the rise-over-run of this 20-day Linear Regression. If the Linear Regression rises 4 points over 2 days, then the slope would be 4 over 2 or 2 (4/2). If the Linear Regression falls 6 points over 2 days, then the slope would be -6 over 2 or -3 (-6/2). A Read More
MailBag February 12, 2010 at 11:02 AM

With developments in Greece, Europe, China and other parts of the world, some investors and traders may want to follow foreign stock indices throughout the day. The main country indices at stockcharts.com are usually EOD, which means they are updated at the end of the day. This includes the Athens General Index ($ATG), German Dax ($DAX) and Shanghai Composite ($SSEC). There are, however, a number of Dow Jones country indices that are updated throughout the day at stockcharts.com. Below is selection of these indices. Read More
MailBag February 05, 2010 at 09:14 AM

SharpCharts users can offset a moving average by adding positive or negative inputs to the indicator parameters. First, start with a SharpChart and a simple moving average. Second, go to the indicator section and to the parameters box. Add a comma and then the number of days for the offset (-11 to offset left and 11 to offset right). A left offset places the moving average further in the past. A right offset places the moving average into the future. This does not, however, increase predictive power. Don’t forget to add extra bars to the chart so you can see a positive offset. Read More