MailBag April 01, 2010 at 02:27 PM
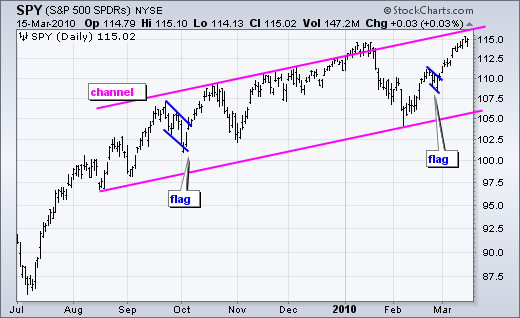
Flags and channels look similar, but there are some key differences between the two patterns. First, flags are short-term patterns that typically extend 1-4 weeks. Channels are longer patterns that extend a month or more. Second, flags form after a sharp advance or decline. A bullish flag slopes down and forms after a sharp advance. A bearish flag slopes up and forms after a sharp decline. Channels are not dependent on the prior move. Third, flags represent a short correction or rest within the ongoing trend. Channels usually define the ongoing trend. The upper and lower trendlines mark Read More
MailBag March 26, 2010 at 10:12 AM

The Market Carpet provides a color-coded visual reference to easily identify stocks with certain RSI levels. Market Carpets can also be used with the Stochastic Oscillator, Bollinger BandWidth, %B, PPO, StochRSI, Price Performance and the Aroon Oscillator. This example will focus on RSI. First, pull up the Sector Market Carpet. Second, change the default indicator “Price Performance” to RSI. Third, click the delta button to turn it white and show absolute levels ranging from 90 to 10. The Market Carpet above shows the S&P 500 stocks by sector with RSI values. The numbers next to Read More
MailBag March 19, 2010 at 10:14 AM
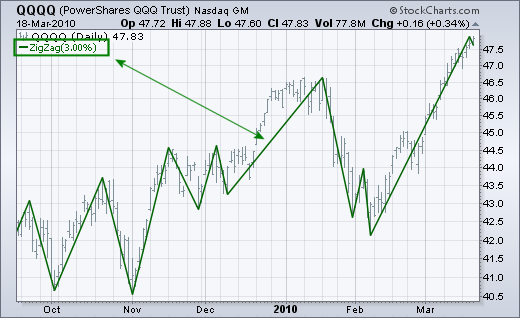
First, let’s start with a basic Zigag. The Zigzag indicator is a hindsight indicator that identifies moves of a certain percentage. For example, a Zigzag (3) would only show movements that were 3% or more. The first chart shows the Nasdaq 100 ETF (QQQQ) with Zigzag (3). There are 12 moves of at least 3% from mid September to mid March. Notice that the Zigzag line turned down the last two days. This is not because QQQQ declined 3% or more. Rather, the last line is always drawn from the most recent peak/trough the current low/high. If 3% swings are too small, the Read More
MailBag March 12, 2010 at 08:31 AM
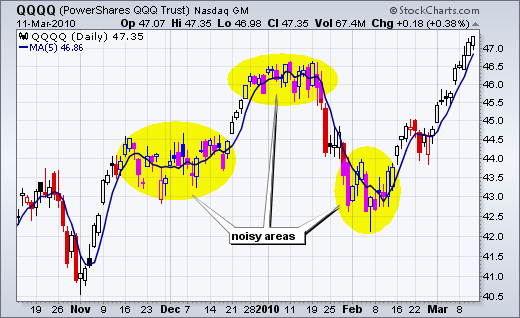
While hiding the price plot seems a bit counter-intuitive, the “invisible” plot can be a useful chart tool. With today’s volatility, price action can look rather noisy, especially during consolidations. Even close-only charts can look rather jagged. Chartists can smooth the data by using a moving average. Moreover, SharpCharts users can choose to show the daily price plot as invisible and only show the moving average. The first chart shows the Nasdaq 100 ETF (QQQQ) with candlesticks and a 5-day moving average. The yellow areas show some noisy periods with seemingly volatile day-to-day Read More
MailBag March 08, 2010 at 05:53 PM

Q: I want to create a 10-day moving average of a 10-day moving average of $TICK. How can I do that? A: While double smoothed moving averages are not something that we support directly there is a way to show them on our charts using a nifty trick involving the MACD indicator. (Note: This method assumes that you want to use Exponential Moving Averages, not Simple Moving Averages.) The key to the trick is to understand that EMA(0) is defined as zero AND that the MACD(x,y) is defined as EMA(x) minus EMA(y). Taken together, those two facts mean that you can plot any EMA you Read More
MailBag March 05, 2010 at 08:06 AM

CandleGlance charts provide an effective means to quickly view numerous charts and select prospects for further analysis. The Free Charting Service at Stockcharts.com allows users to view CandleGlance charts and single out individual charts for further inspection. Users with Basic Charting Service or higher can view create a specific CandleGlance list, annotate individual charts and save these to their list. Click here to see the different subscription options. This article will show an easy way to select individual charts for further analysis, save the annotations and return to the same Read More