MailBag December 31, 2010 at 01:08 PM

Reminiscences of a Stock Operator - Annotated Edition by Jon Markman: This book is always at the top of my list. In fact, I refer to this book many times throughout the year. Many of the Wall Street axioms we hear today can be found in the pages of this classic. Markman examines Livermore’s strategies and then explains how they can be applied in today’s markets. These techniques will help both new and experienced traders. Stock Trader's Almanac 2011 by Jeffrey Hirsch: This book adds another dimension to technical analysis. Hirsh dissects the historical record to tell us what has and Read More
MailBag December 23, 2010 at 02:29 PM

There is no right or wrong setting for an indicator. It really depends on your trading or investing style (timeframe, objectives, risk tolerance etc). One of the best ways to find your ideal settings is to display the same indicator in different windows with different settings. The chart below shows the S&P 500 ETF (SPY) with the TRIX indicator four times. TRIX (15,9) is the 1-period percent change in the 15-day Triple Smoothed exponential moving average. The signal line is the 9-period EMA of TRIX. The big window shows TRIX positioned behind the price plot, which makes it easy to Read More
MailBag December 17, 2010 at 08:16 AM

Chartists can place two horizontal lines with different colors on an indicator by adding the indicator twice. The trick is to set the second indicator behind the first. This means the two indicators will overlap and it will look as if one indicator is plotted, when in fact two are actually there. Placing a second indicator behind the other can be done by choosing “Behind Ind.” as the “Position”. Horizontal lines can be added by clicking advanced options and adding overlays. Chartists can also add two lines of the same color by entering two comma-separated numbers in the parameters box. he Read More
MailBag December 10, 2010 at 10:38 AM

StockCharts.com offers a number of ways to track commodities. There are specialized indices from Dow Jones as well as funds that focus on a specific commodity or commodity group. The table below shows 19 indices from Dow Jones. This provides an easy way to track cocoa, corn, coffee, sugar, wheat and other commodities. The second table shows 17 commodity related funds from iPath. Some of these correspond directly to a Dow Jones index above. In other words, the Dow Jones index is the underlying security and the iPath fund is trying to duplicate the performance of this index. Read More
MailBag December 03, 2010 at 08:50 AM
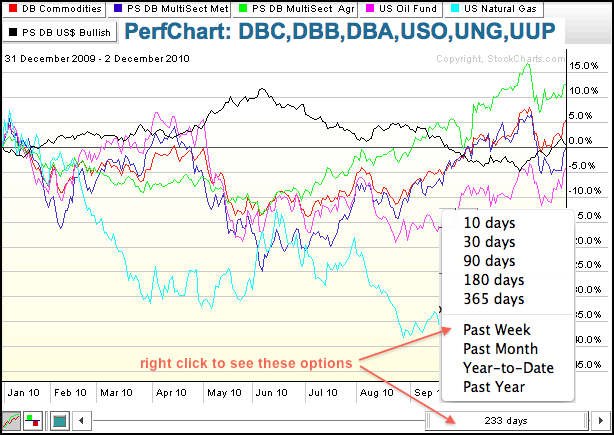
PerfCharts are the classic way to create performance charts that can compare up to 10 different securities using daily data. These are nifty because users can dynamically change the look-back period with the slider at the bottom. Users can also view these as line charts or in histogram format. The PerfChart below shows the performance for six different commodity ETFs in 2010. Users can even choose from a set of look-back options by clicking the slider with the right mouse button. Click this image to see a live chart.SharpCharts subscribers can create intraday performance charts with Read More