MailBag November 26, 2010 at 09:55 AM
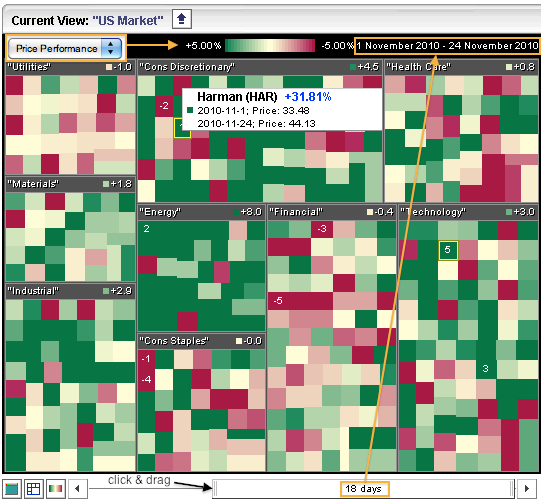
The market carpet can be used to find sectors and stocks showing relative strength or relative weakness. Starting with the S&P Sector Carpet, users can select the desired timeframe using the slider at the bottom. Click the left end and drag left to expand the number of days. Alternatively, right click on the slider to quickly select a set number of days. This carpet runs 18 trading days, which covers November. Notice how the colors change as the slider extends. The whole slider can be moved by clicking the center and dragging left or right. Click this image for a live example. The Read More
MailBag November 19, 2010 at 09:30 AM
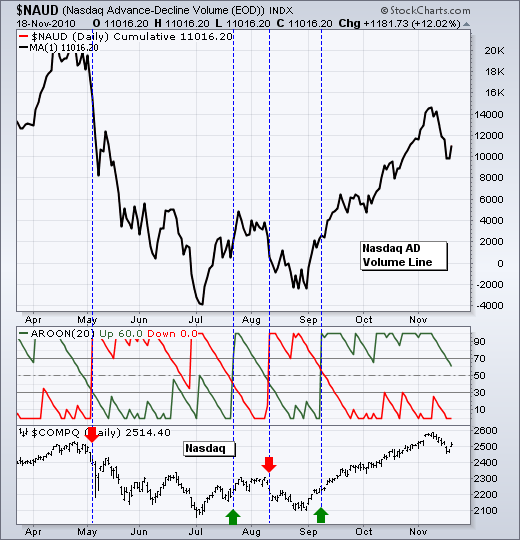
Most of the indicators available in SharpCharts can also be applied to cumulative breadth indicators, such as the AD Line or AD Volume Line. As with a normal stock or ETF, these indicators can help determine the trend or identify momentum shifts in breadth. The indicator signals are the same for a cumulative breadth line, a stock, index or ETF. Even with the AD Line, chartists can look for divergences in momentum indicators, moving average crossovers or Bollinger Band squeezes. he chart above shows the Nasdaq AD Volume Line with Aroon in one indicator window and the Nasdaq in the other Read More
MailBag November 12, 2010 at 03:18 PM
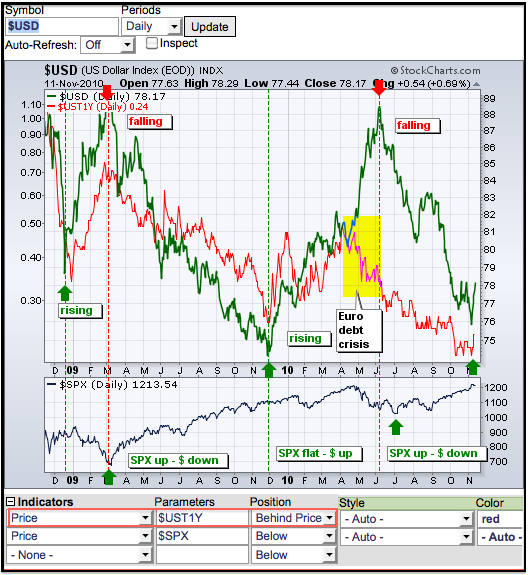
SharpCharts users can compare two securities by plotting the price of one behind the price plot of another. This can help chartists determine if two securities are positively or negatively correlated. Positively correlated securities rise or fall together. Negatively correlated securities move in opposite directions. SharpCharts users can add another security to a chart by selecting “price” as an indicator, entering the security’s symbol as the parameter and positioning the security “behind price”. The resulting chart will show the price plots for two securities in the main chart window Read More
MailBag November 07, 2010 at 10:48 AM
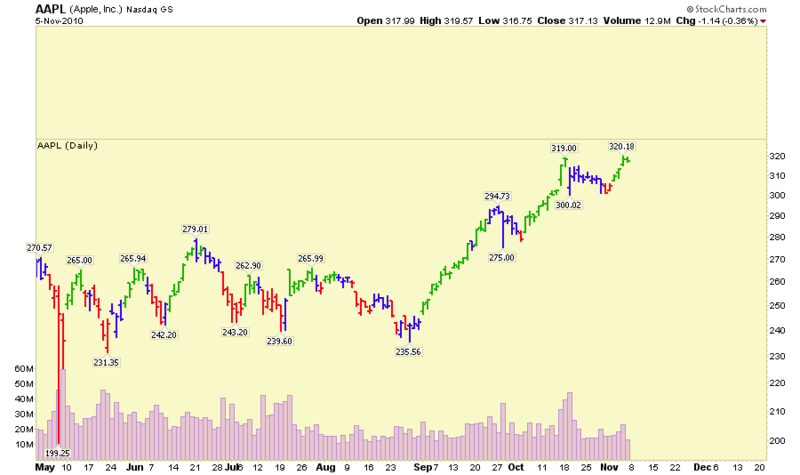
Q: How can I add more vertical space above my chart so that I can extend my annotations into the future? I see where I can use the "Extra Bars" setting to add more space on the right side, but how do I add space to the top (or bottom)? A: While there is no direct way to add more vertical space to a chart's Price Plot area currently, there is a "trick" you can use to accomplish what you are looking for. (By the way, we will be adding a way to adjust a chart's vertical axis at some point in the future. It's one of those features that we keep trying to add but never can seem to Read More
MailBag November 05, 2010 at 10:06 AM
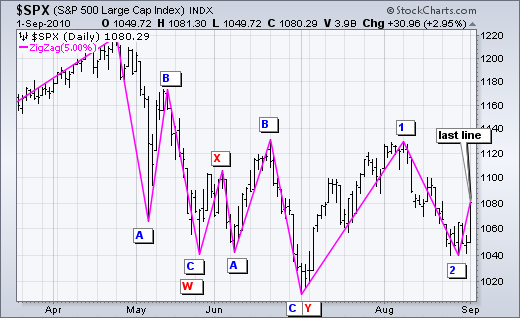
How can the Zigzag feature be used in chart analysis? The ZigZag feature on SharpCharts can be used to identify meaningful reaction highs and lows. Filtering out random fluctuations can make it easier for Elliott Wave counts. The ZigZag feature is not an actual indicator. Instead, it follows price action and reverses when prices move a minimum percentage. The default setting is 5%. This means the ZigZag feature will reverse after a move of at least 5%. Chartists can set this percentage higher to decrease sensitivity or lower to increase sensitivity. The chart below shows the ZigZag Read More