MailBag October 28, 2011 at 06:28 PM
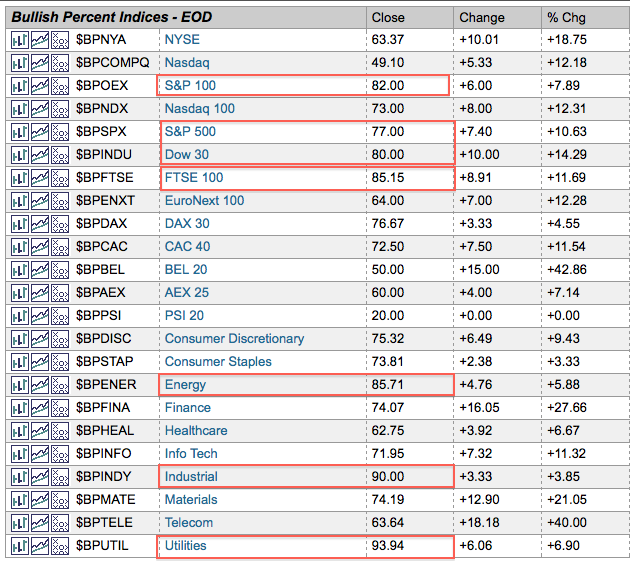
The Bullish Percent Indices (BPIs) measure the percentage of stocks in an index that are on a P&F buy signal. This means the stock is on a double top breakout signal, which means the most recent X-Column exceeded the prior X-Column. At its most basic, the Bullish Percent Index favors the bulls when above 50% and the bears when below 50%. The cup is more than half full above 50%, but more than half empty below 50%. Click here for a live market summary. StockCharts.com offers Bullish Percent Indices for a number of US indices, the 10 S&P sectors and a number of European indices Read More
MailBag October 21, 2011 at 11:33 AM
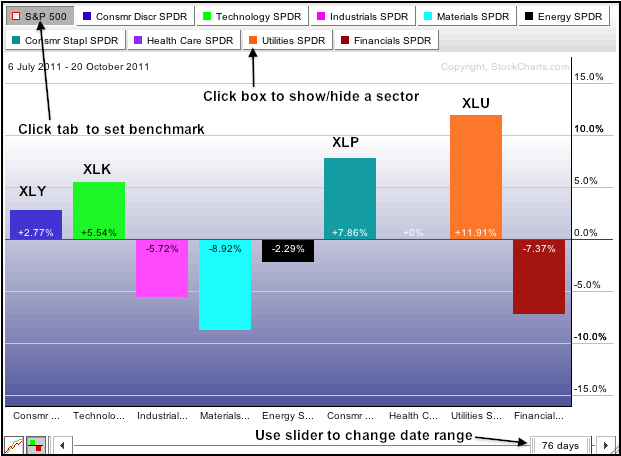
Sector rotation within the S&P 500 can be measured by using the Sector PerfChart. The default version of this chart shows the performance of the nine sector SPDRs relative to the S&P 500. If the S&P 500 is up 2% and the sector is up 4%, then relative performance would be +2%. This is because the sector is up more than the S&P 500 and outperforming. If the S&P 500 is down 4% and the sector is down 2%, relative performance would also be +2%. This is because the sector is down less than the S&P 500 and holding up better. Simply subtract the absolute gain/loss in the Read More
MailBag October 14, 2011 at 09:51 AM
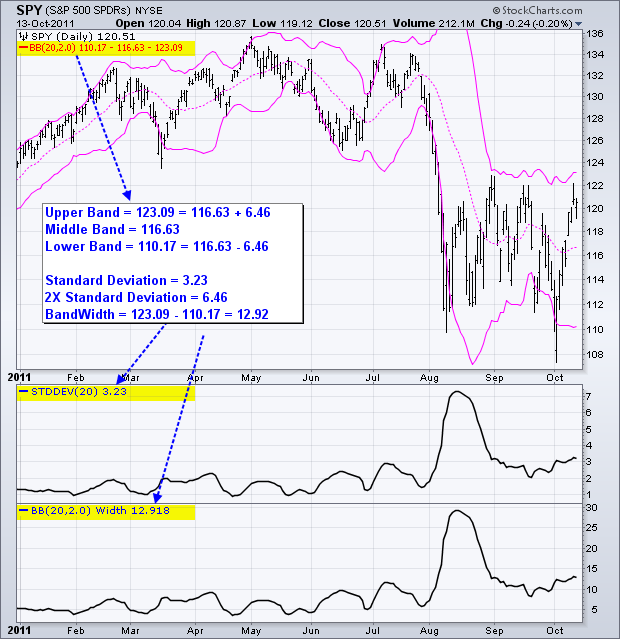
The short answer is with the Bollinger Band Width indicator in SharpCharts. Now for the long answer. Created by John Bollinger, Bollinger Bands are volatility bands with a moving average in the middle. The default setting is 20-periods and 2 standard deviations. This means the moving average, middle line, is a 20-period simple moving average. The upper and lower bands are then set 2 standard deviations from this moving average. 20-periods is also used for the standard deviation, which is a measure of volatility. By using the standard deviation to set Band Width, Bollinger Bands are Read More
MailBag October 07, 2011 at 10:48 AM
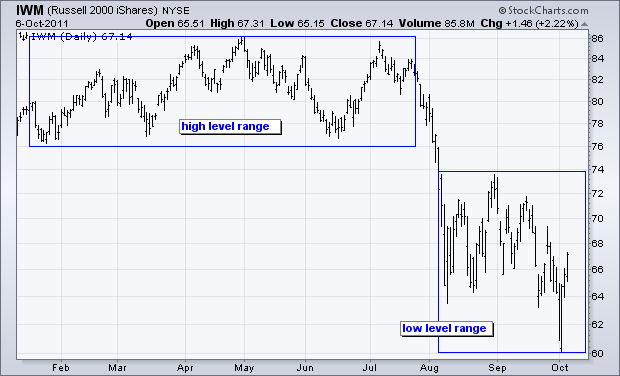
The 3 to 5 day swings in the stock market have been quite wild since early August. The Russell 2000 ETF (IWM) boasts 11 swings of 5% or more since the second week of August. That is 11 swings in eight weeks or one swing every 4 days. It is enough to make a trader seasick. Chartists with a longer focus can filter out these moves by using moving averages or even a long-term Stochastic Oscillator. The first chart shows IWM trading within a high level range early in the year and a low level range the last two months. The one big decline in between sets the long-term tone. The current trading Read More