MailBag September 28, 2012 at 09:34 AM
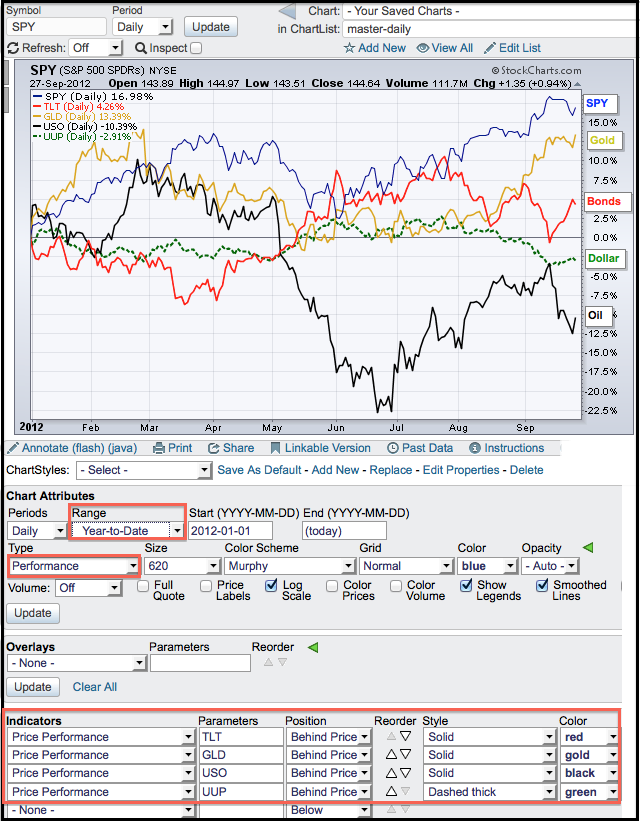
Chartists can measure price performance on a SharpChart by choosing “performance” as the chart type or “price performance” as an indicator. The chart below shows the year-to-date performance for the S&P 500 ETF, the 20+ Year T-Bond ETF, the Gold SPDR, the US Oil Fund and the US Dollar Fund. The “year-to-date” option can be found in the drop down list for the “range”. Chartists can also change the colors and line styles for easy differentiation. The image below highlights the place to make these adjustments and create a similar chart. Read More
MailBag September 21, 2012 at 10:02 AM
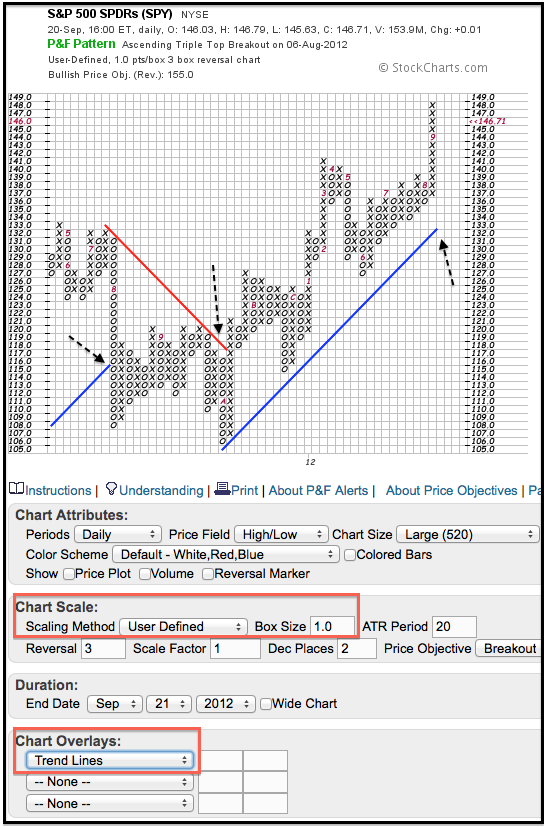
Trend lines are drawn at 45-degree angles on P&F charts. A rising trend line is called a Bullish Support Line, while a falling trend line is called a Bearish Resistance Line. StockCharts.com users can add trend lines automatically by selecting them as a chart overlay. Chartists can also add Bollinger Bands, moving averages and price-by-volume. The chart above shows the S&P 500 ETF (SPY) with user-defined boxes (1-point per box). Working from left to right, the ETF broke the Bullish Support Line (blue) with a long O-Column in August 2011. Once Read More
MailBag September 14, 2012 at 08:55 AM
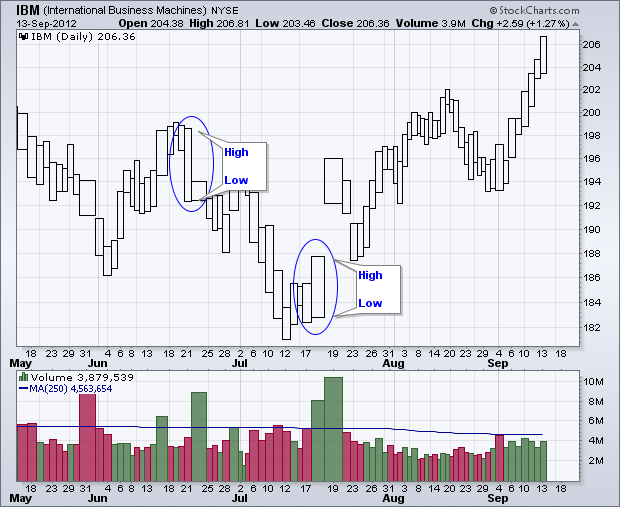
Both Equivolume and CandleVolume charts incorporate volume directly into the price plot. Volume is used to set the width of the boxes in Equivolume charts and the width for candlesticks in CandleVolume charts. There are, however, two main differences. The chart below shows IBM using Equivolume boxes. These boxes are always hollow and only show the high-low range. Equivolume charts are good for gauging volume, defining the overall trend and identifying chart patterns. The second chart shows Read More
MailBag September 07, 2012 at 09:32 AM
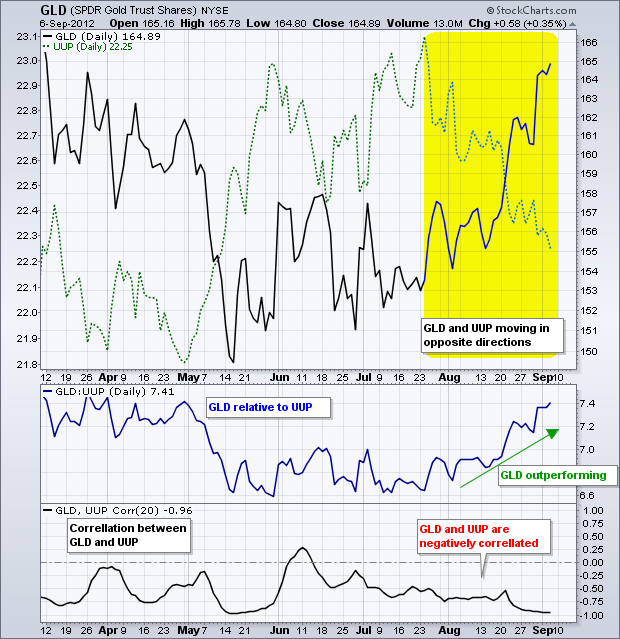
There are at least three ways to compare the performance of two securities. First, chartists can simply place the plot of one security in the main chart window and add the plot of another behind this plot. The chart below shows the Gold SPDR (GLD) in black and the US Dollar Fund (UUP) in green (dotted). Notice how these two moved in opposite directions from late July to early September. Click this image for a live version Chartists can also compare two securities by using the price relative and the Correlation Read More