MailBag April 26, 2013 at 09:22 AM
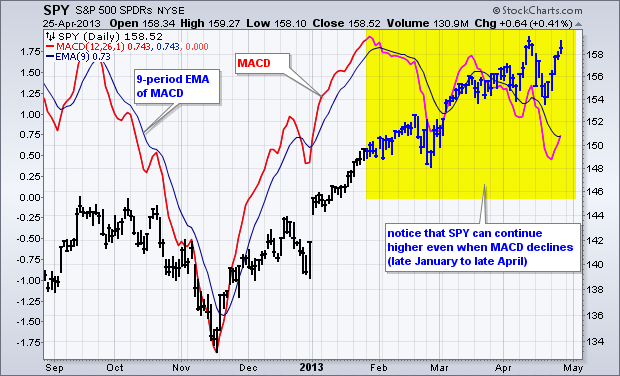
SharpCharts users can place indicators above the main window, below the main window or as an overlay in the main window. These choices are available using the drop down menu for “position”. Positioning MACD “behind price” makes it easy to compare indicator movement with price movement. The chart below shows the S&P 500 ETF (SPY) with MACD positioned behind the price plot. Note that I removed the histogram and signal line by changing the parameters to (12,26,1). The last number (1) makes the signal line a 1-day EMA of MACD, which essentially hides it. The signal line was re-added by Read More
MailBag April 19, 2013 at 09:51 AM
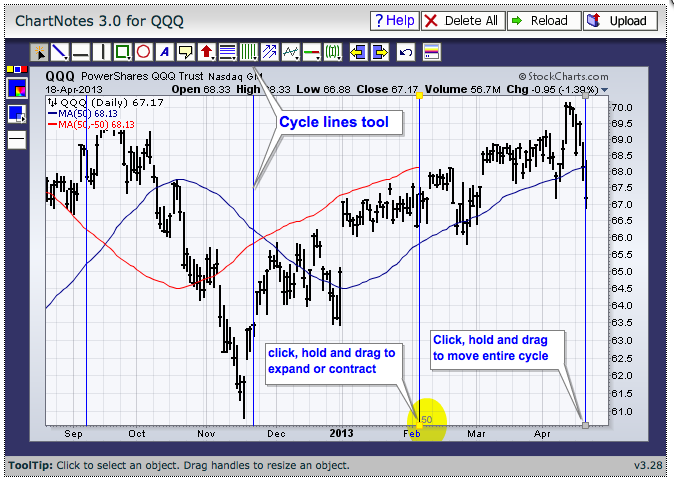
Chartists sometimes need to count back a specific number of days on a chart. This can be to set a cycle high/low or simply to count the number of trading days since a high/low. Chartists can easily count by using the cycle lines tool on SharpCharts. When annotating a chart, this tool can be found in the middle of the top tool bar. Click the icon to activate, move to the chart and click-drag to place the cycle lines on the chart. The chart above shows the Nasdaq 100 ETF (QQQ) with the cycle lines starting on Thursday. Chartists can click-drag the gray box at the Read More
MailBag April 12, 2013 at 09:15 AM
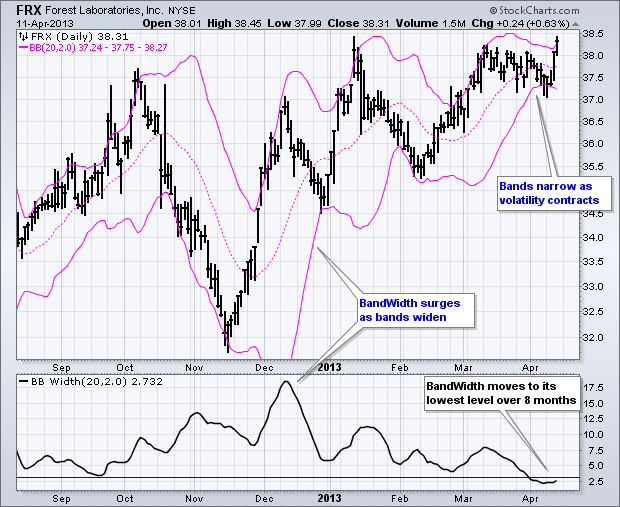
Chartists can quantify the difference between the two Bollinger Bands by using the BandWidth indicator. Bollinger Bands start with a 20-day simple moving average of closing prices. The actual bands are then placed two standard deviations above and below this moving average. These equidistant bands expand as volatility increases and contract as volatility decreases. John Bollinger theorized that volatility contractions lead to volatility expansions, or price moves. Chartists can eyeball the price chart to identify volatility contractions and use the BandWidth Read More
MailBag April 06, 2013 at 06:09 PM
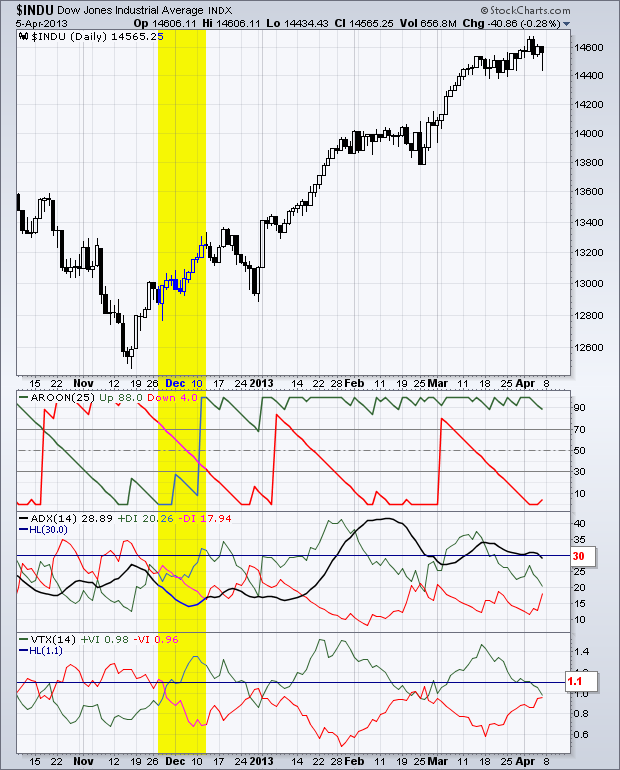
StockCharts.com has three indicators that separate positive (up) and negative (down) price movement: the Directional Movement Indicators, Aroon and the Vortex Indicators. These indicators are shown as pairs with the green line measuring positive price movement and the red line measuring negative price movement. These indicator pairs trigger signals when the lines cross. Some crosses are short and only last a few days. Some crosses last for weeks or even months. Chartists can reduce whipsaws by requiring the indicator to reach a specific threshold to validate a signal. This means the Read More