MailBag June 28, 2013 at 07:54 AM
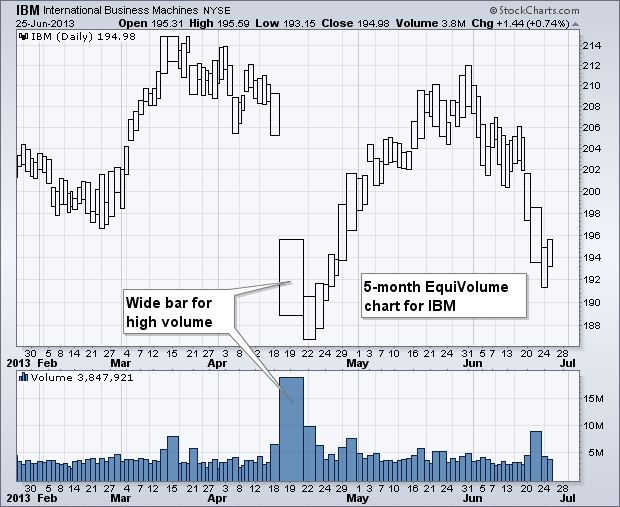
CandleVolume and EquiVolume charts merge volume and price. This gives chartists the power to measure volume while looking at the price chart. A second look at volume bars or a volume indicator is not necessary. CandleVolume charts use candlesticks that incorporate the open, high, low and close. EquiVolume charts use bars that incorporate only the high and low. The width of the candlestick or bar reflects relative volume. While both have their merits, it is clear that CandleVolume charts offer more information, namely the open and close for the period. This is pretty important information Read More
MailBag June 21, 2013 at 09:32 AM
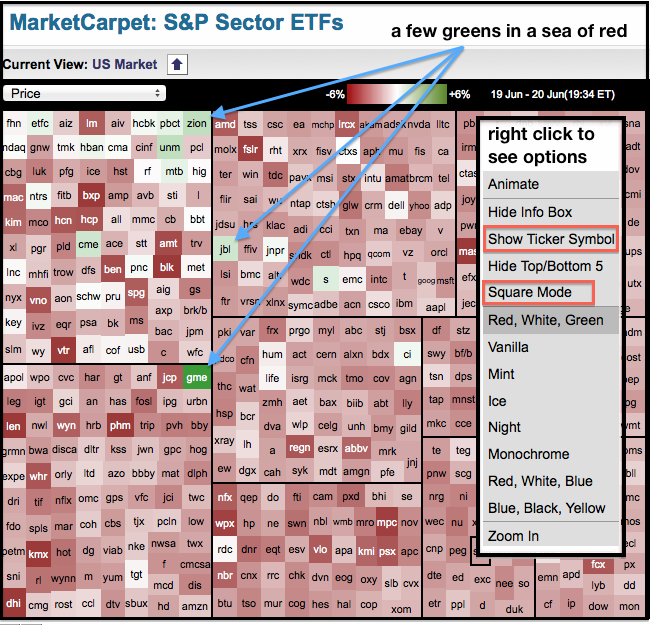
Chartists can use our color-coded MarketCarpets to easily separate the winners from the losers. The image below shows the Sector MarketCarpet with a sea of red. The red squares represent the decliners, while the green squares show the gainers, which are few and far between. The darker the red, the bigger the loss. The winners are easy to spot on the MarketCarpet because the green squares stick out. There are also some “whitish” squares visible. These squares are for stocks with very small gains or losses. Stocks with a small gain or loss show relative strength when the overall market is Read More
MailBag June 14, 2013 at 08:55 AM
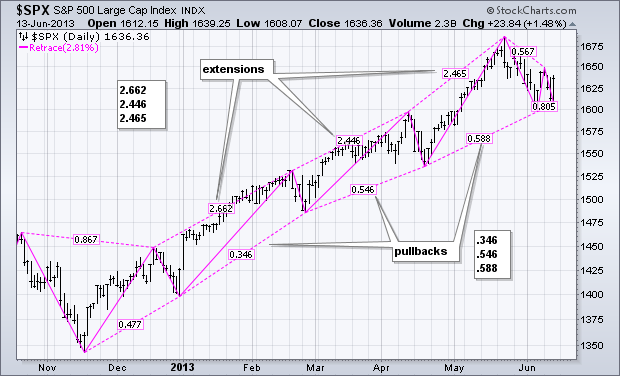
Chartists can use the Zigzag (retrace) indicator to show retracement amounts directly on the price chart. There are two types of Zigzag in the overlays section: Zigzag and Zigzag (retrace). Zigzag is not an indicator per se. Instead, it filters price changes by requiring a minimum movement before changing direction. A Zigzag set at 5 would only show price moves that were 5% or more. Zigzag (retrace) adds another dimension by showing the retracement amounts as dotted lines. *LINEBR** The chart above shows the S&P 500 with the default value for the Zigzag Read More
MailBag June 07, 2013 at 08:51 AM
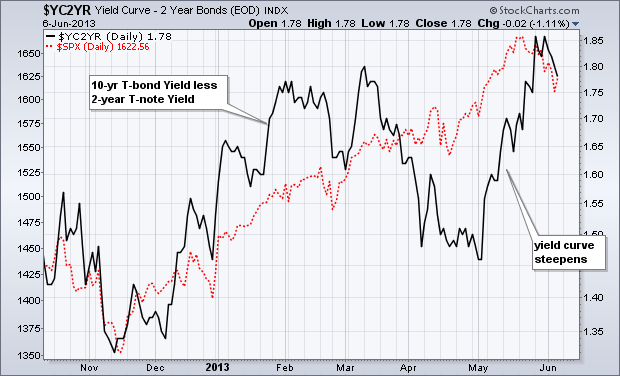
Chartists can track the yield curve by using the dynamic yield curve tool or the yield curve symbols. $YC2YR plots the difference between the 10-year Treasury Yield ($TNX) and the 2-Year Treasury Yield ($UST2Y). $YC3MO plots the difference between the 10-year Treasury Yield ($TNX) and the 3-month Treasury Yield ($UST3M). Even though the 10-year Treasury Yield surged in May, this long-term rate rose at a much faster rate than the short-term rate. This caused the yield curve to steepen, which is positive for the stock market and the banking sector. Read More