MailBag September 27, 2013 at 09:50 AM
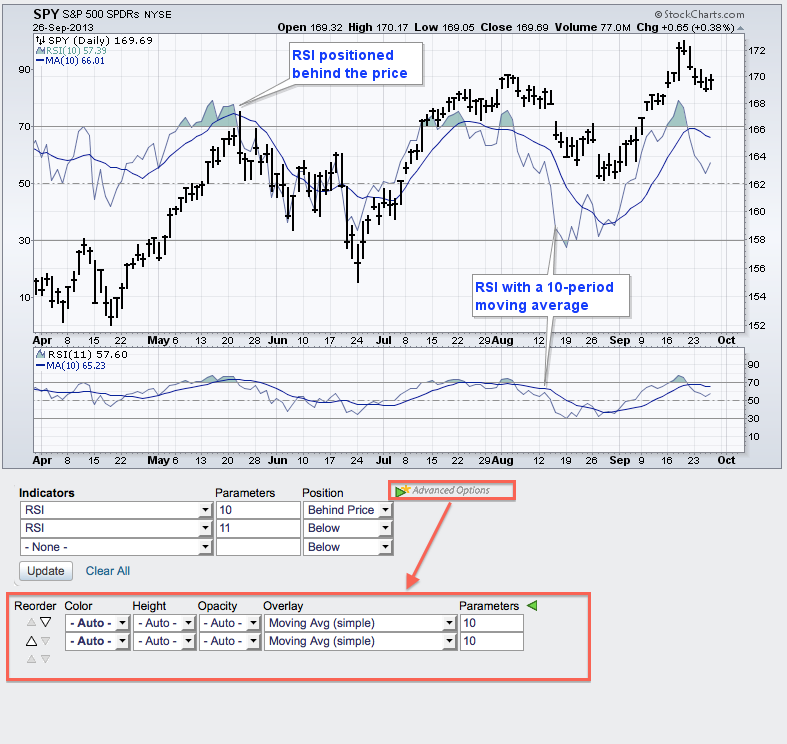
Chartists can easily add an indicator to an indicator using the advanced options in SharpCharts. First create your chart with an indicator. This example shows the S&P 500 ETF (SPY) with RSI in the indicator window. Scroll down to the indicator section and click the "advanced options" triangle. Chartists can now add an array of indicators to their indicator by choosing from the overlay section. Adding a moving average to RSI makes it easier to identify the upturns and downturns in momentum. Read More
MailBag September 20, 2013 at 10:40 AM
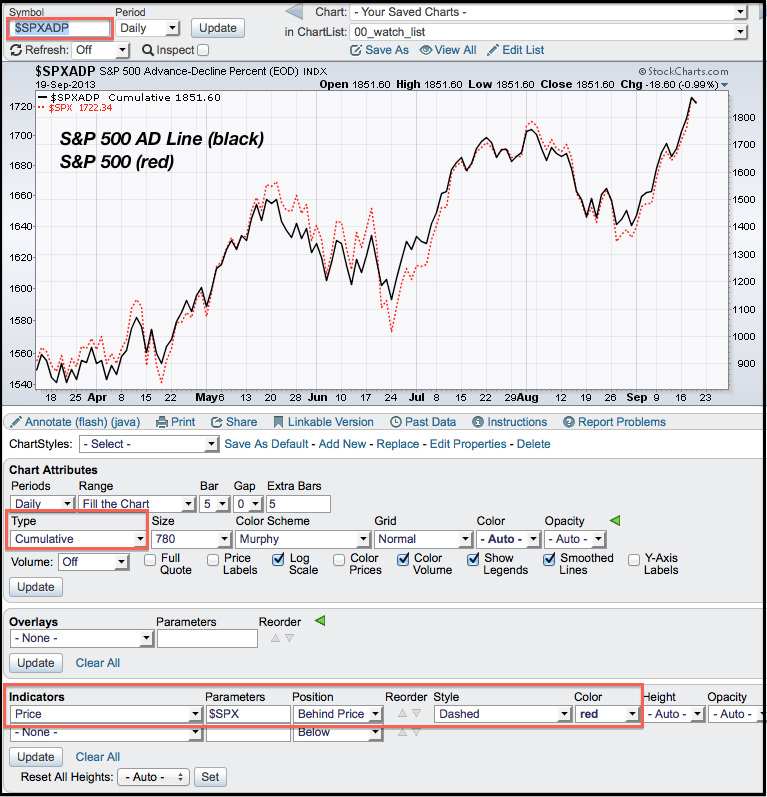
Chartists can easily create the AD Line for the S&P 500 using the SharpCharts workbench. This indicator starts with AD Percent, which is advances less declines divided by total issues. Note that StockCharts calculates AD Percent for dozens of indices and ETFs, including the nine sector SPDRs. Chartists first create a chart using S&P 500 AD Percent ($SPXADP). From this indicator, go below the chart and into the “Chart Attributes” section. Here chartists can change the chart “type” to cumulative. Chartists wishing to add the S&P 500 to the chart can do this by adding another Read More
MailBag September 13, 2013 at 09:41 AM
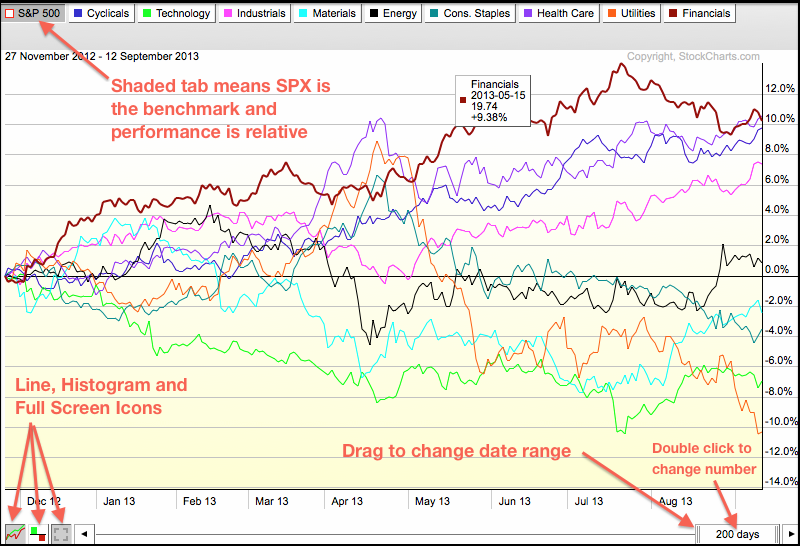
Click here for a live PerfChart There are three main ways to customize a PerfChart. First, chartists can change from relative performance mode to absolute performance mode by clicking one of the tabs at the top. All white tabs means the chart is in absolute performance mode, which means the gains or losses are actual. A shaded tab sets that security as the benchmark and the others are shown in relative performance mode, which means the gains and losses are relative to the benchmark, which is usually the S&P 500. At Read More
MailBag September 06, 2013 at 08:55 AM
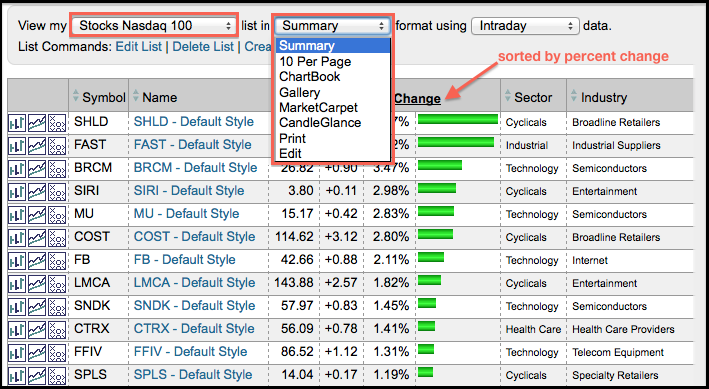
ChartLists are integral to getting the most out of StockCharts because these lists house our stocks, indices, ETFs and market indicators. ChartLists are not just lists though. StockCharts offers many different viewing options that make it easy for Chartists to quickly scan a group of stocks. The first image shows a ChartList for the Nasdaq 100 in “Summary” format, which shows the complete ChartList with various columns. Chartists can click a column headings to choose a specific sort. In this example, I sorted by “Percent Change” to put the biggest gainers at the top. Read More