MailBag November 29, 2013 at 01:55 PM
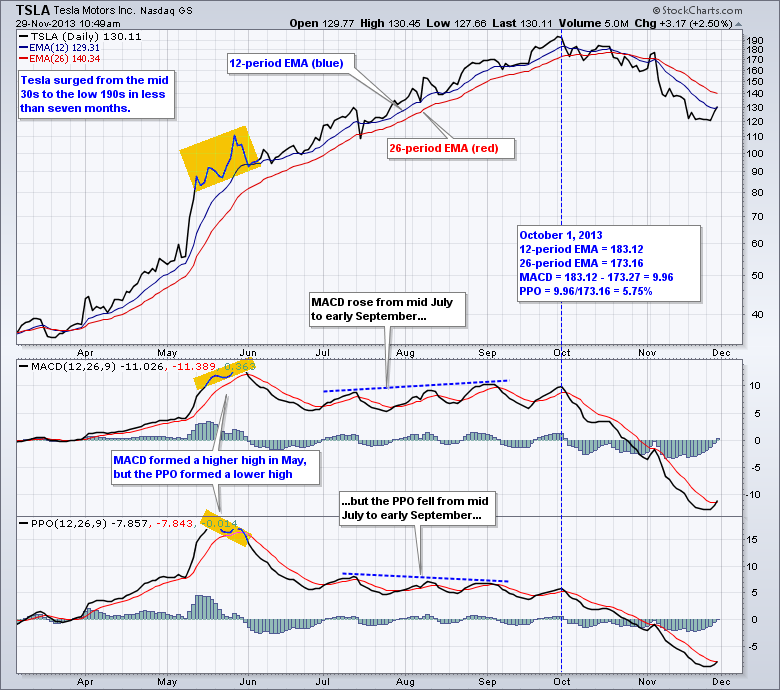
MACD and the Percentage Price Oscillator (PPO) both measure the difference between two moving averages, usually the 12-period EMA and the 26-period EMA. MACD measures the absolute difference, but the PPO measures the percentage difference by dividing this difference by the longer moving average. Even though these indicators usually track each other quite closely, differences will emerge when there are large price changes in the underlying security. he example above shows Tesla (TSLA) with a big price move as the stock advanced from the mid 30s to the low 190s in less than seven months Read More
MailBag November 21, 2013 at 03:09 AM
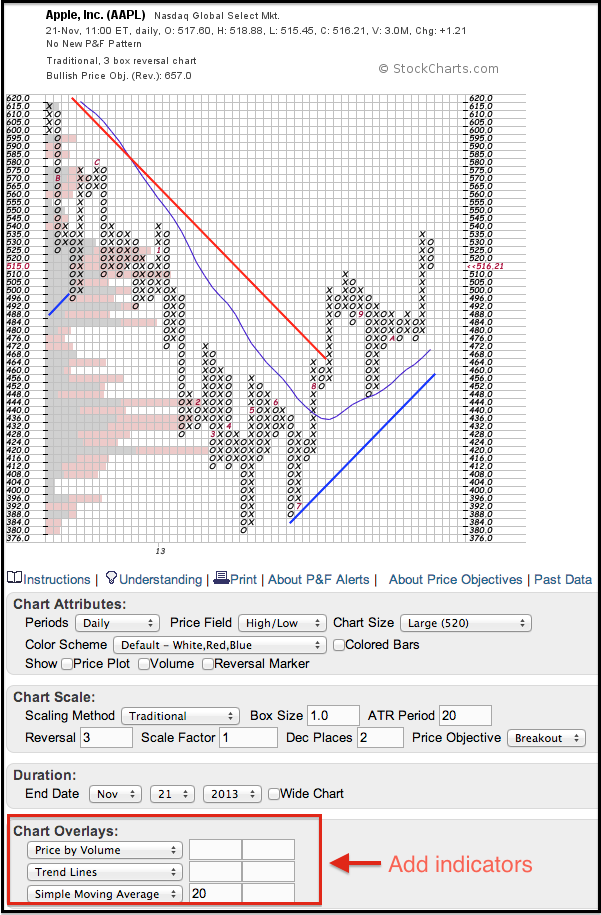
Chartists can add trend lines, moving averages, Bollinger Bands and Price-by-Volume to any Point & Figure chart. First, start by creating a P&F chart using the “create a chart” drop down menu at the top of any StockCharts page. Chartists can then find the indicator options in the “chart overlays” section below the chart. Trend lines are shown by default. The rising blue line is a Bullish Support Line that slopes at a 45 degree angle. The falling red line is a Bearish Resistance Line that slopes at a 135 degree angle (180 less 45). The overall trend is up when above the Bullish Read More
MailBag November 15, 2013 at 10:10 AM
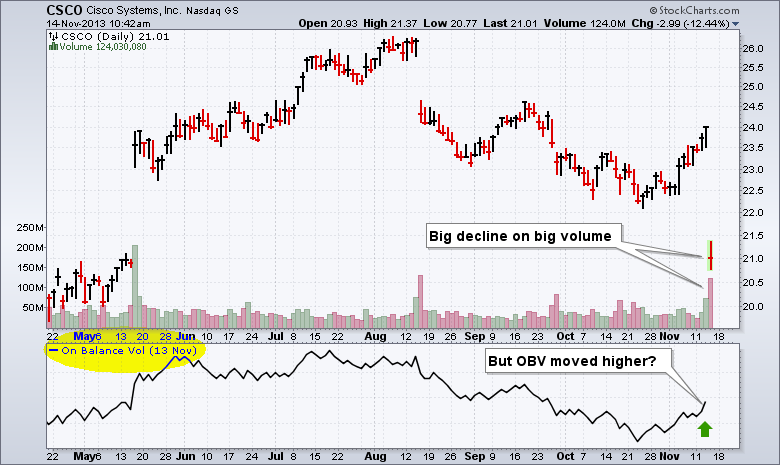
Volume-based indicators are updated when each time period is complete. For daily charts, this means volume-based indicators are updated after the market close. Similarly, volume-based indicators on 30-minute charts are updated at the end of each 30 minute period. Price and volume data are both subject to change prior to a period's end. Waiting for definitive data ensures that the volume-based indicators are based on correct, and unchanging, data. he example above shows Cisco (CSCO) gapping down on big volume. On Balance Volume (OBV) should be moving lower, but the chart shows an advance Read More
MailBag November 08, 2013 at 10:32 AM

Chartists can count the number of price bars on a chart using the cycle lines tool. Knowing the number of bars or days can help chartists set indicator parameters and average out correction timeframes. As with all annotation tools, the cycle lines tool can be found using ChartNotes, which is the workbench you see when annotating a chart. The first step is to choose the price move. In the example below I chose the decline from 22-May to 24-June (red lines) and the advance from 19-April to 29-October (green lines). Next choose the cycle lines tool at the top (icon with vertical lines). Move Read More